Box Score: Arkansas at Alabama
| Stat | Alabama | Arkansas |
|---|---|---|
| Stat | Alabama | Arkansas |
| Points | 24 | 21 |
| Total yards | 413 | 250 |
| Rush yards | 175 | 100 |
| Rush attempts | 43 | 36 |
| Yards per rush | 4.1 | 2.8 |
| Pass yards | 238 | 150 |
| Pass attempts | 10-21 | 14-24 |
| Yards per pass | 11.3 | 6.3 |
| 1st downs | 18 | 13 |
| 3rd down eff | 6-14 | 4-14 |
| 4th down eff | 0-0 | 0-0 |
| Turnovers | 0 | 0 |
| Tackles | ||
| Sacks | ||
| Penalties-Yds | 5-45 | 2-13 |
| Possession | 29:08 | 30:22 |
The box score tends to agree with the rest of the analysis: aside from TOP and, um, the score, the Tide had major advantages in most meaningful categories. Unfortunately, tacklers/sacks data was again unavailable this week.
Not seeing graphs below? Tap here to fix it.
Team Success Rates over time (cumulative)
I was in a wedding during this game (I know, I know, Fall Saturday weddings in the South, but it was admittedly really nice), so I only caught segments of this game, and otherwise had to periodically check the score on my phone.
One of the last bits I could catch live was this relatively robust 2nd quarter, where it looked like the Tide were evolving into their final form and finally putting a conference foe away soundly. It was a relief given I wouldn’t be able to catch the rest of the game on a screen.
But then, this weird little bump happened at the end of the 3rd quarter, and the visiting Arkansas Razorbacks started showing life. Their cumulative efficiency started climbing from a putrid ~11-12% SR to something between 20-30%. And that’s cumulative … a number that’s really hard to shift that late in the game.
So imagine my surprise in checking my phone and seeing that Alabama was barely hanging onto a once-robust lead. So much for the “final form.” Fortunately, obviously, the defense stood up just enough (and the Tide offense strung together a long enough drive) to close out the game as a disappointing barely-win.
All that said, the Tide held significant efficiency and explosiveness advantages through most of the game. I hate to hand-wave away another disappointing offensive performance, but it does seem that the scoreboard was less kind to the Tide than the advanced metrics … that is, that “it wasn’t played as close as the score looked.”
Success and Explosiveness by Play Type
It turns out that that those respective advantages for the Tide came from the two different phases of the game: Bama was much more efficient than the Hogs when running the ball, but much more explosive when passing it.
This flip-flopping performance has been a weird one to observe over the course of the season — one game we’re a rushing team, the other we’re a passing one — and according to efficiency we’re looking at a continuation of that odd “trend.” But in this one each phase did bring attributes that were evidently important in winning this game at all.
Rushing and Passing Success (cumulative)
The tospy-turviness of the Bama offense is on full display in this one, and there were even trend shifts mid-game. We did our usual bumbling around in the 1st quarter before the 2nd quarter showed both phases of the game improving … though passing was the higher performer (with much more explosiveness, to boot).
But right around the halftime whistle things apparently changed: we went into the locker room after 4 unsuccessful passes in a row, and that trend continued in a sad burn-down throughout the 2nd half (literally until the last Alabama pass was thrown). The passing SR went from ~65% in the mid-late 2nd quarter, to less than 30% cumulatively — cut in less than half — in the 4th quarter. That’s a really bad run.
Meanwhile, the rushing game started oddly strong in the 3rd quarter, with 5 of the first 6 Bama rushes being successful, and 4 of those being explosive to boot. For a team that had shown little of that in the 1st half, it looked something like an adjustment. But, lo, the rushing success deflated, too, and settled at an average ~42% SR by the end. Maybe I’m glad I didn’t watch this one?
Flipping over to the Hog’s part of this chart, it’s grim. Their rushing game was DOA until the halfway mark — just absolute dominance from the Tide’s rushing defense — until things turned around for some reason in the 3rd quarter as Arkansas picked themselves off the mat. Go away, piggies!
Rushing rate (cumulative)
The Tide went back to “a rushing team” in this game, though settled into a more balanced posture after the 1st half. The Hogs pulled the opposite trick by starting out passing before they drifted into a balanced (but rushing-first) team.
Fortunately for the Tide, their rushing worked better.
Play Map: Yards and Result by Play
As to the sub-headline of this article: the Alabama offense has been playing only about a quarter or two of efficient football per game this year. That effort has thankfully resulted in some wins, but rarely big ones … and it’s frustrating to see such promise and such malaise in a single game.
In this game, it was the 2nd quarter, with sprinkles of success in the 1st and 3rd. That collection of solid dots right around there — and the requisite lift of that Average Extra Yards line — is our “spurt” of the week. And apparently we can’t afford multiple of those in a single week.
Interestingly, these explosive plays — especially the rushes — to trend towards the 15 yard cut line for counting as explosive. I wouldn’t be surprised if the isoPPP Explosiveness metric — featured in the SEC Graphing article (that I’ll post later) — is less kind to the tide than Explosiveness Rate (XR).
Success and Explosiveness by Quarter
The quarters chart reflects similar game trends — 2nd quarter good, 4th quarter bad — but it does make a few points of note clearer:
- Alabama ran 22 plays in the 2nd quarter. Play counts do correlate with efficiency, but it makes sense that just a single somewhat successful quarter was enough to win the game given how many plays that represented
- It also makes it easier to win when your opponent posts a zero percent success rate in the same 2nd quarter. Wow, talk about a complete (but temporary) performance across the offense and defense
- Alabama had been reasonably explosive for the whole game — and oddly so in the otherwise-weak 3rd quarter — but didn’t put up a single explosive play in the 4th.
SR, XR, and Play Count by Drive
This one tells a similar story to the quarters and line charts, given that the Tide offense found basically all of their success around the 2nd quarter, followed by three 3-and-outs in a row. The latter are really ugly, but at least we got more “middling drives” than we’ve gotten in some games (where literally only a handful of drives gets us anything of value, from points to field position).
There are also a few important mega-drives, with a high-efficiency 10-play one after our “warm up period,” then likely a critical (but inefficient) clock-burning version to seal the game up. The last one is odd given that it followed all of those 3-and-outs … were we subbing in backups too early before putting in maximum starters for the final drive?
On the Hogs’ side of the chart, they’ve got plenty of 3-and-outs of their own, and fewer positive drives. But damned if they didn’t end the game with 3 substantial and long drives of their own. Two of these weren’t particularly efficient, but you don’t need to be super efficient to string together a long drive.
Success and Explosiveness by Down
The Tide portion of this chart isn’t particularly meaningful. The 1st down explosiveness is notable (but not unusual as a general football trend), and the 3rd down performance of both teams might say something about play-calling and/or anxious defenses.
But Arkansas really did seem to make things work only on 3rd down, which adds color to that Drives chart (where practically their only successful scoring drives were all drives with a lot of plays). The Hogs were also undeniably explosive on their 14 3rd down attempts, which is painful to see.
Success and Explosiveness in the Red Zone
The 2023 Tide have made a habit this season of winning on Red Zone efficiency, but it wasn’t to be in this one. As Josh said in Initial Impressions, the Hogs made the most of their (few) opportunities down here, with only 4 plays in the Red Zone.
Alabama was respectably efficient down here, but only ran 8 plays in the Red Zone in their own right. More than Arkansas, but pretty few on the day. I guess we’re an “explosive passes for points” team now, even when we’re rushing more often.
Success and Explosiveness by Distance to go
Alabama’s offense actually won across every distance, which is strange but speaks to some degree of being the more consistent team on Saturday. Again, the Tide had efficiency in short yardage — that 3rd-and-3 failure notwithstanding — but this time we petered out in the long yardage situations.
Fortunately, for how unusually inefficient the 10+ yard distance was for Alabama, we were mighty explosive from out there. And that adds up when you run 43 plays (!) from that kind of distance.
Top Rushers
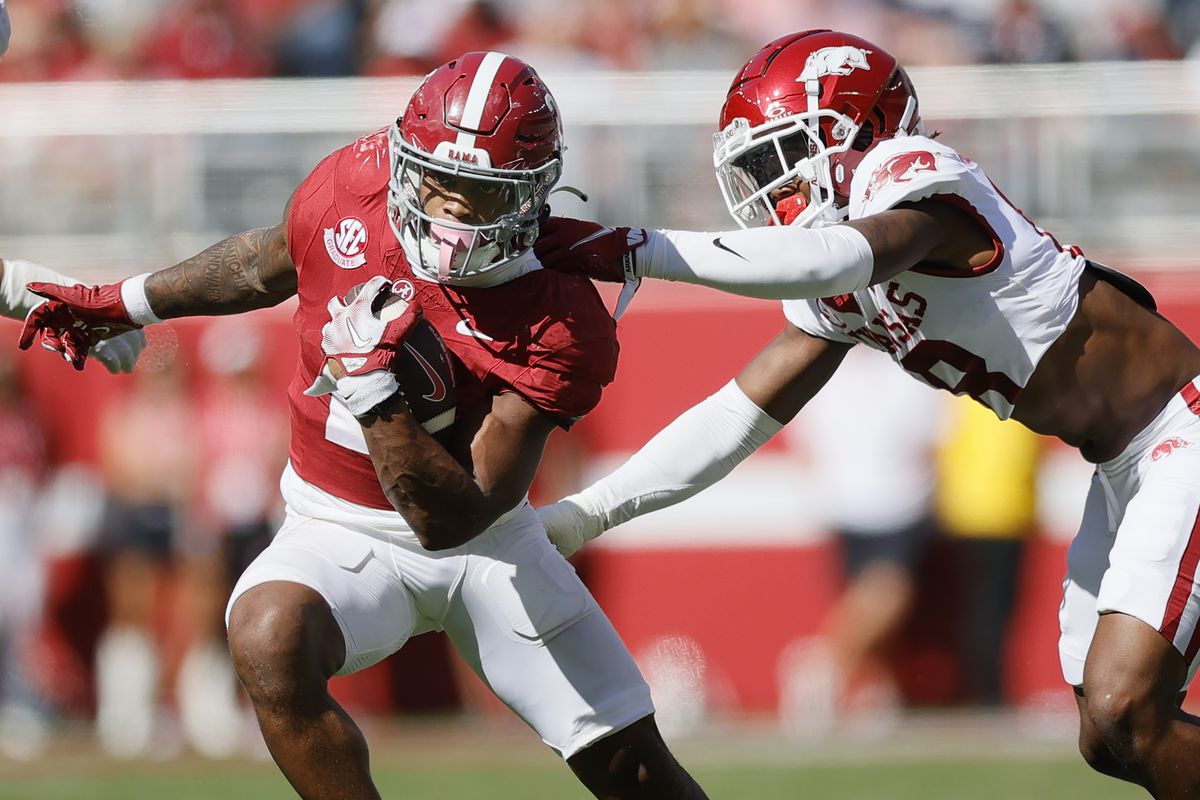
Jase McClellan reclaims the image feature this week: he wasn’t especially efficient (8/16 for 50% SR, with 2 explosives) but he was respectably so and had more attempts. Unfortunately, I don’t have another more obvious player standing out in the graphs this week (as tacklers data is unavailable again).
Otherwise, it was nice to see some explosives from Jam Miller and Roydell Williams, but then disappointing to see Jalen Milroe’s line being such low-efficiency (and with no explosive runs).
Top Passers
You want a positive? No interceptions! Plus, Jalen Milroe hardly threw any caught balls that weren’t successful plays (which hasn’t always been the case this year).
The bad news? It’s probably because they were incompletions, instead. Milroe’s 5 explosive passes did what they needed to to put points on the board, but otherwise this isn’t a very efficient passing line, even by Milroe’s otherwise good standards.
Top Receivers
The receivers line shows some explosiveness — especially from our resident prodigal receiver, Jermaine Burton — but otherwise is short (only 5 Tide receivers had catches on successful plays) and shallow (none of them caught more than 2).
Another week without Tacklers data available in the play-by-play … and the trend hasn’t been improving. Sorry folks.
All in all, it wasn’t the big win we were hoping for, but these stats agree that the Tide was the notably better team on the field on Saturday. We’ll have to take it for now, and hope we build towards a better performance against the Vols this upcoming Saturday.

Loading comments...