If you would like to see and play with the interactive version of these graphs you can find them at https://github.com/MCurve7/mcurve7_cfb/tree/main/RBR/2023 You just need to download the Alabama_(year)_regular_wk??_(opponent).html file and open it in a web browser.
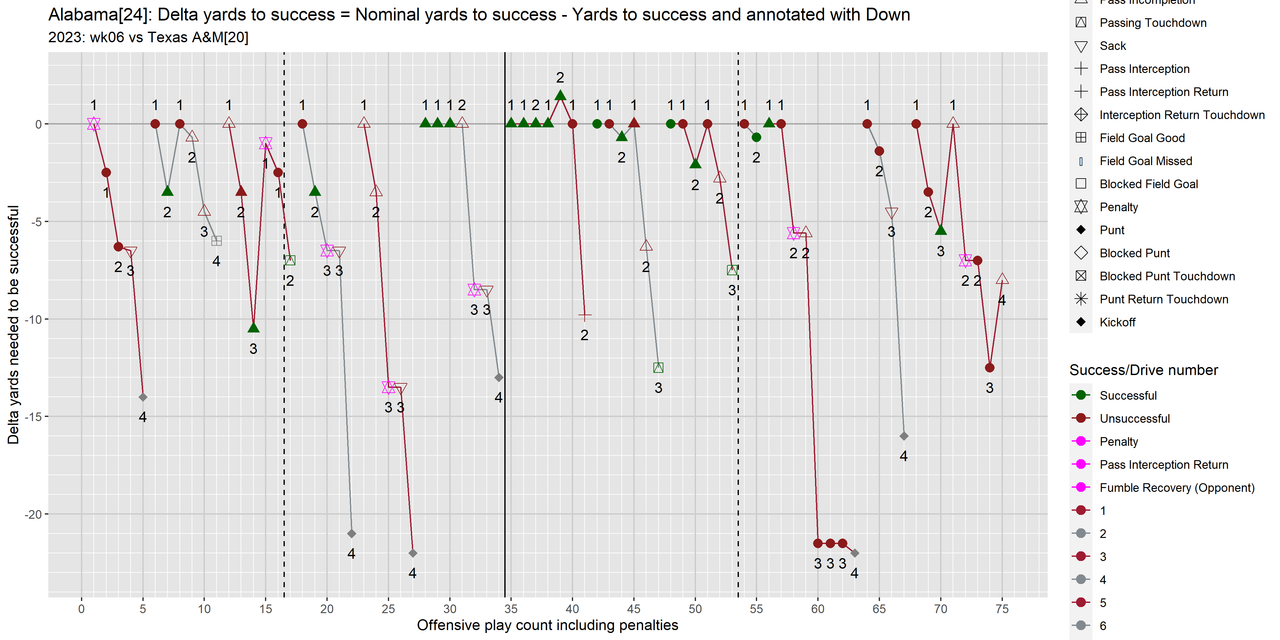
This weeks data missed most of the penalties, of all weeks ugg. I hand added them, but didn't have time to adjust the yardage gained or lost so that part of the graphs will mostly be in error.
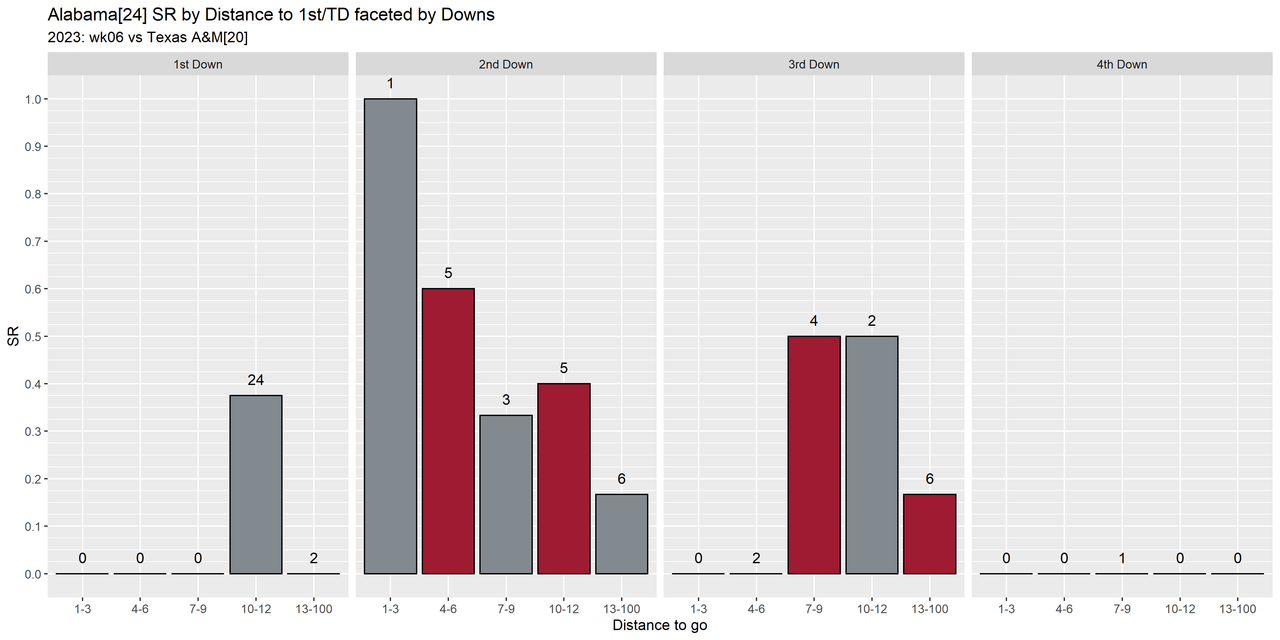
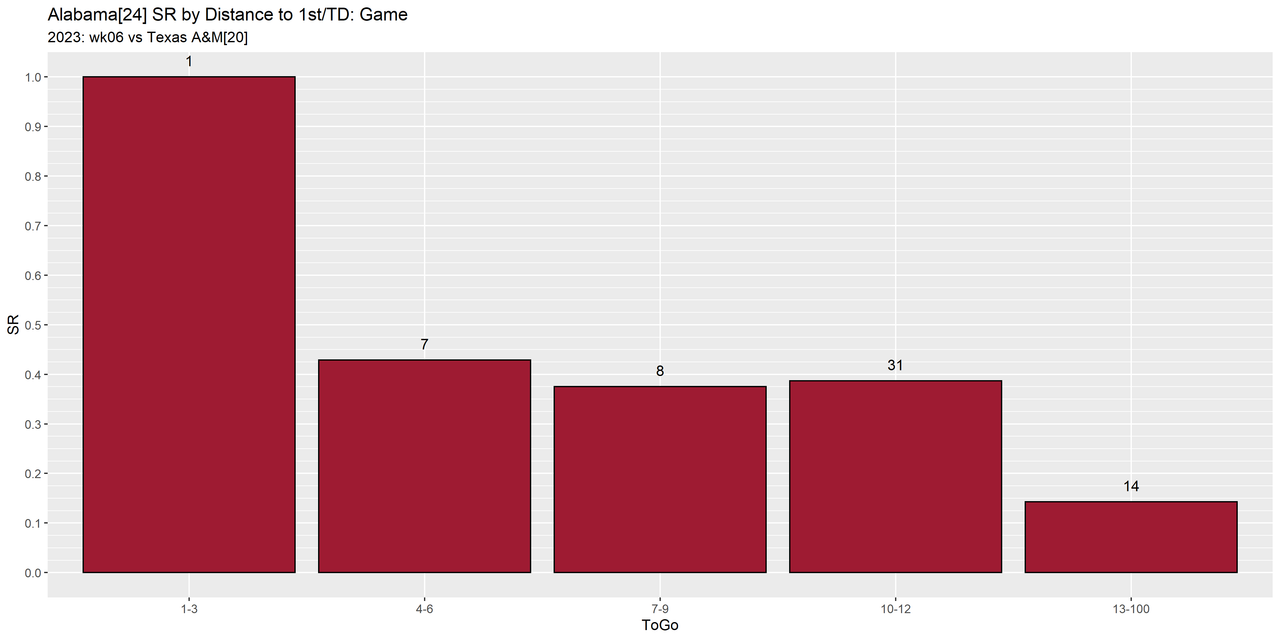
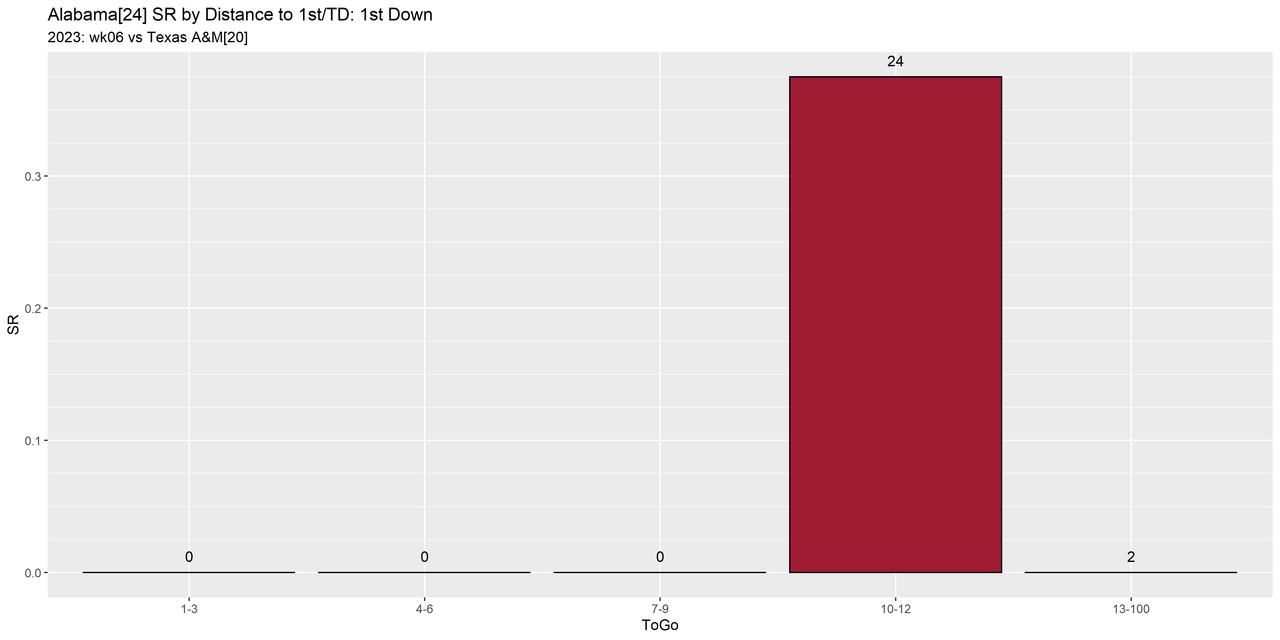
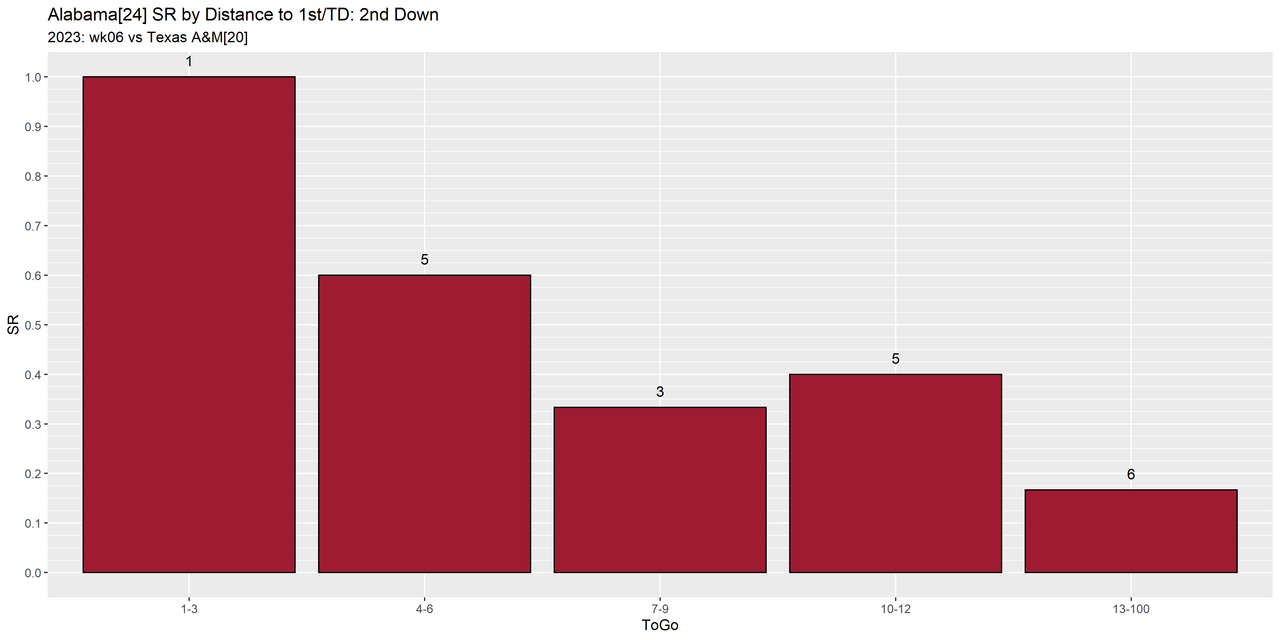
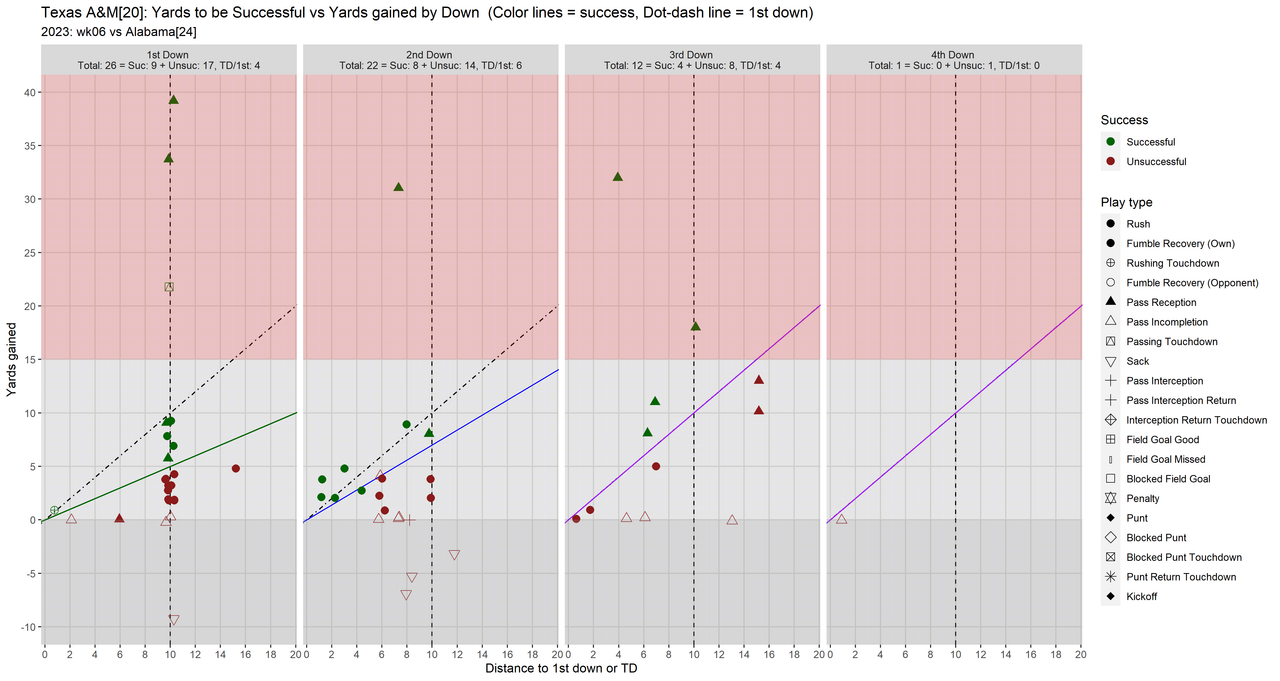
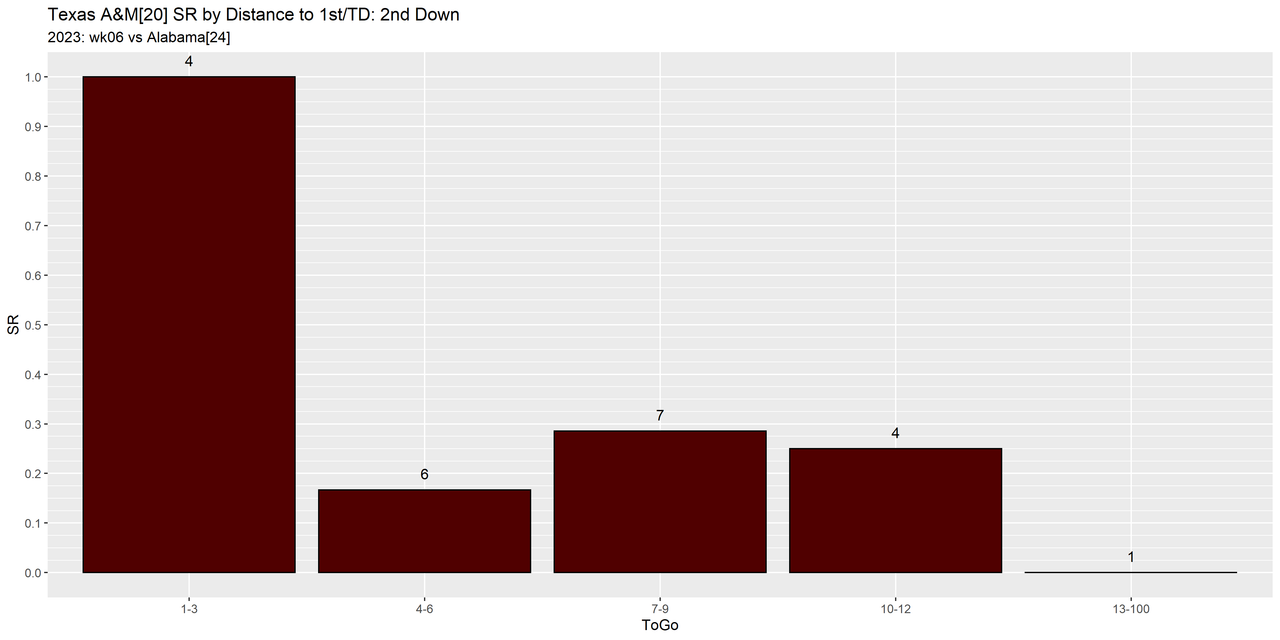
I'm interested to see what balloons' charts will show for SR by down, but just looking at the table and graph below it doesn't look good especially on 1st down where we had nearly twice as many unsuccessful plays as successful. While we look better on 2nd down our third down looks pretty bad and that makes sense if we look at the Distance to 1st/TD, Yards gained statistics by down below.
Success by down: Alabama, 2023, week 06, Opponent: Texas A&M
| Down | Successful | Unsuccessful | Total | TD/1st |
|---|---|---|---|---|
| 1 | 9 | 17 | 26 | 6 |
| 2 | 8 | 12 | 20 | 7 |
| 3 | 4 | 10 | 14 | 4 |
| 4 | 0 | 1 | 1 | 0 |
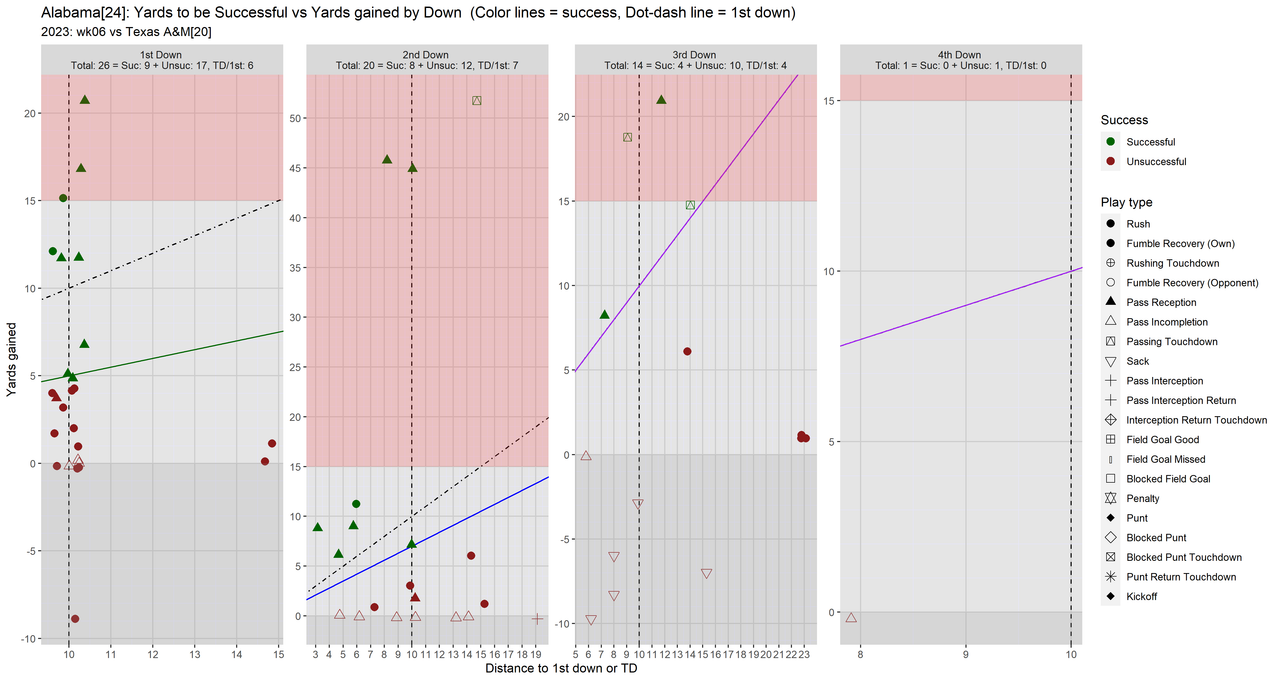
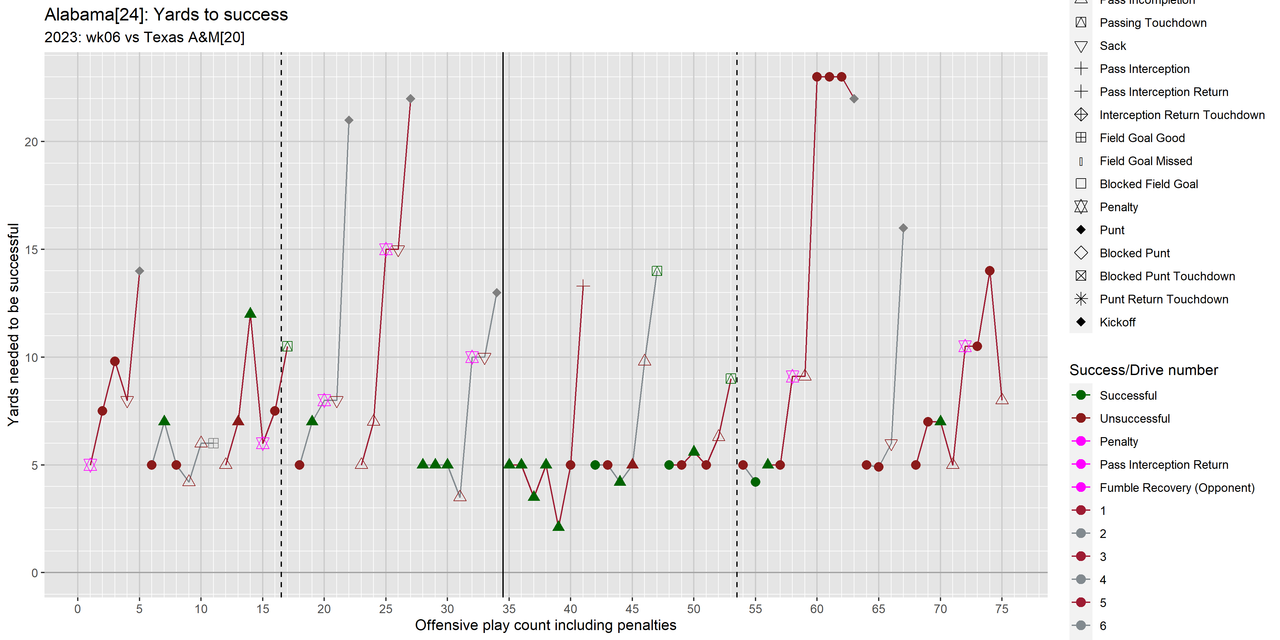
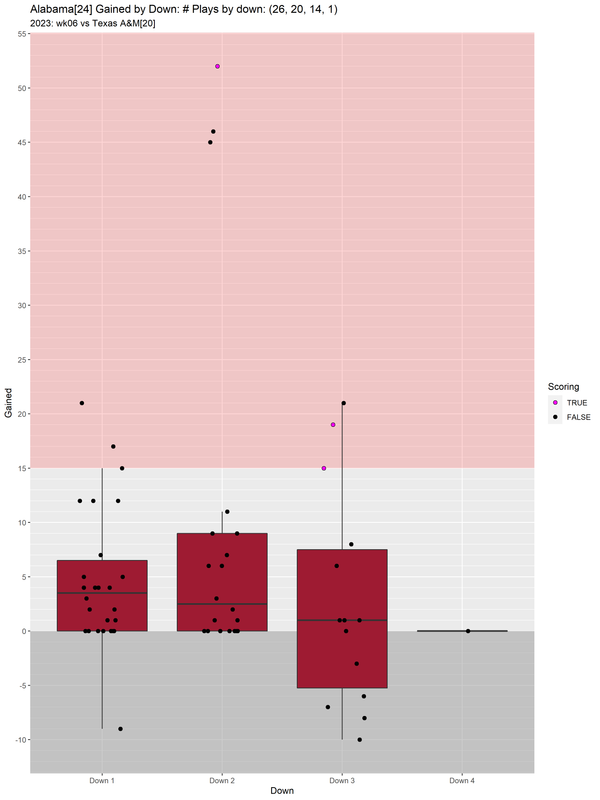
I wasn't going to talk much more about this until I had a chance to look at history, but there are some things you just don't need history to know is bad. Our mean and median distance from a 1st/TD on first down was 10.4 and 10 respectively which is about what you would expect. But for second down we had a mean of 9.75 and median of 10, so we were at almost the same distance from a 1st/TD on 2nd as we were on 1st down. Third down was even worse, we had a mean of 12.7 yards and a median of 11 yards!
Distance to 1st/TD, Yards gained statistics by down: Alabama, 2023, week 06, Opponent: Texas A&M
| Down | Count | Δ_plays | Mean distance | Std distance | Median distance | Mean gained | Std gained | Median gained |
|---|---|---|---|---|---|---|---|---|
| 1 | 26 | 0 | 10.3846 | 1.35873 | 10.0 | 4.69231 | 6.56518 | 3.5 |
| 2 | 20 | 6 | 9.75 | 4.17858 | 10.0 | 9.9 | 16.7077 | 2.5 |
| 3 | 14 | 6 | 12.7143 | 6.2932 | 11.0 | 2.71429 | 9.94159 | 1.0 |
| 4 | 1 | 13 | 8.0 | NaN | 8.0 | 0.0 | NaN | 0.0 |
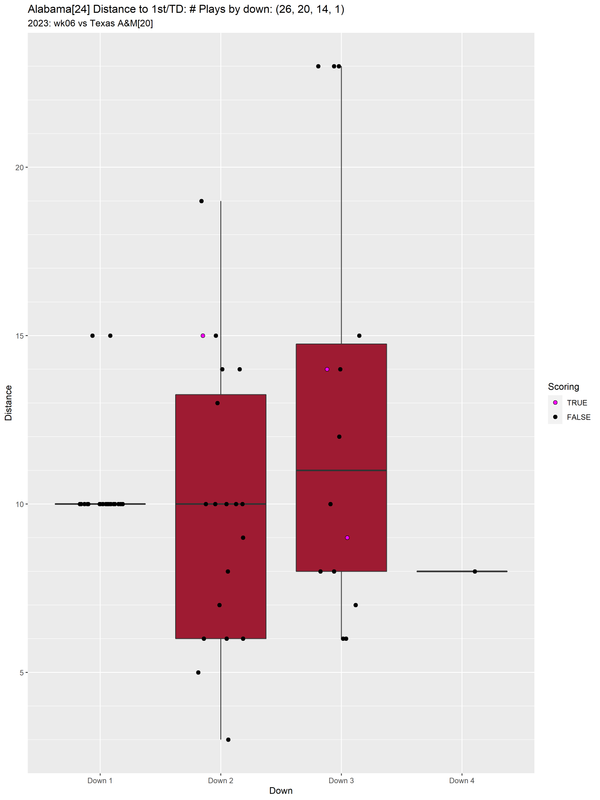
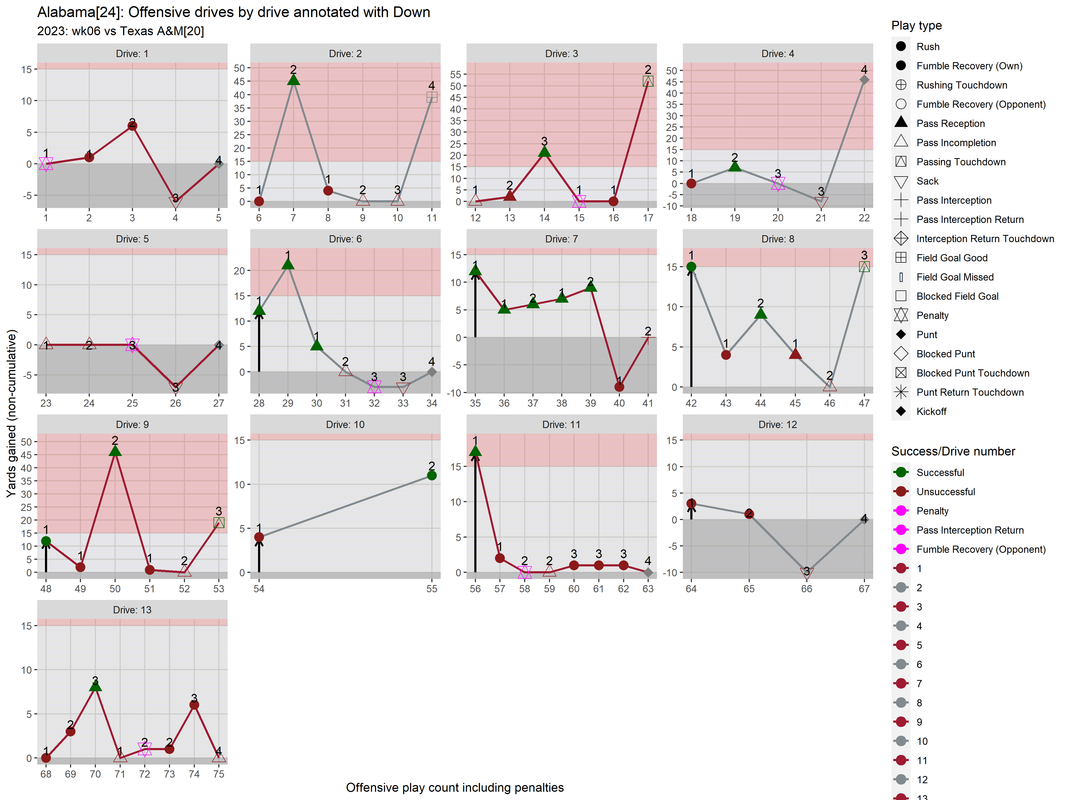
I fast-forwarded through GameDay and SECNation until the Bama segment came on and what they repeated was that if we ended up in anything other than 2nd and medium or 3rd and short then TAMU's defense was going to eat our lunch. Given that we were in 2nd and worse than medium for 14 of 20 for those plays and for all of our 3rd downs (14) we were in medium or worse, it is quite impressive that we won this game.
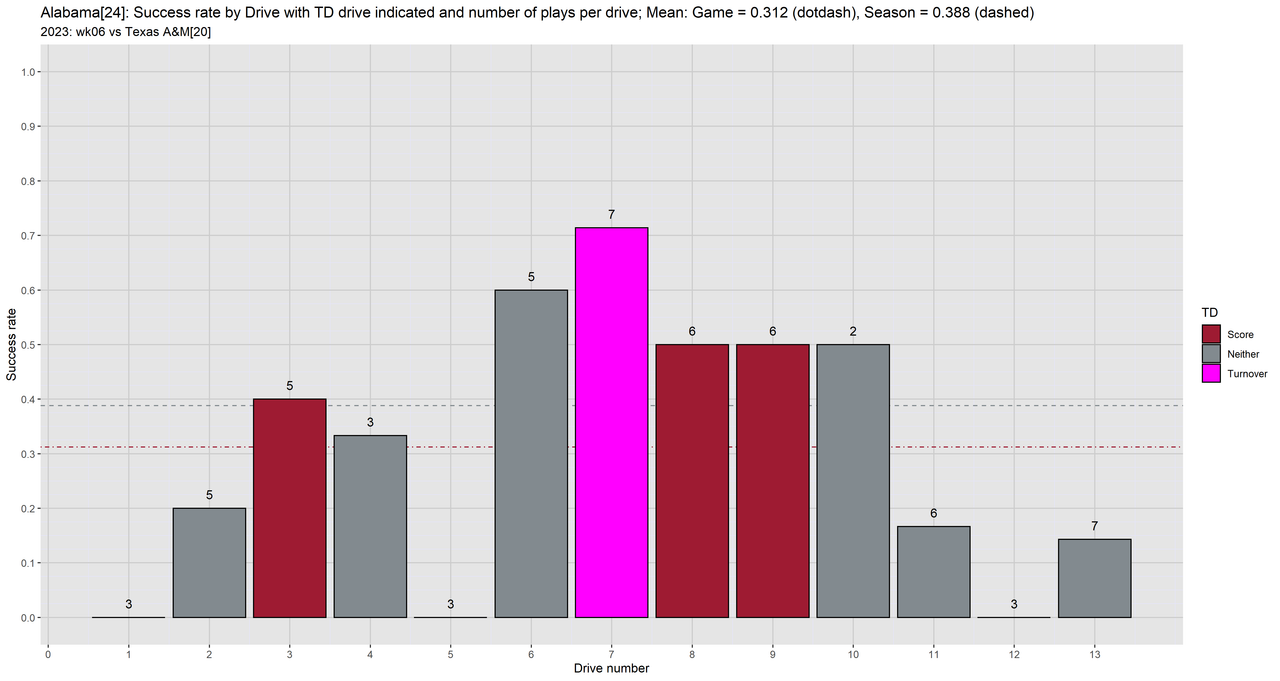
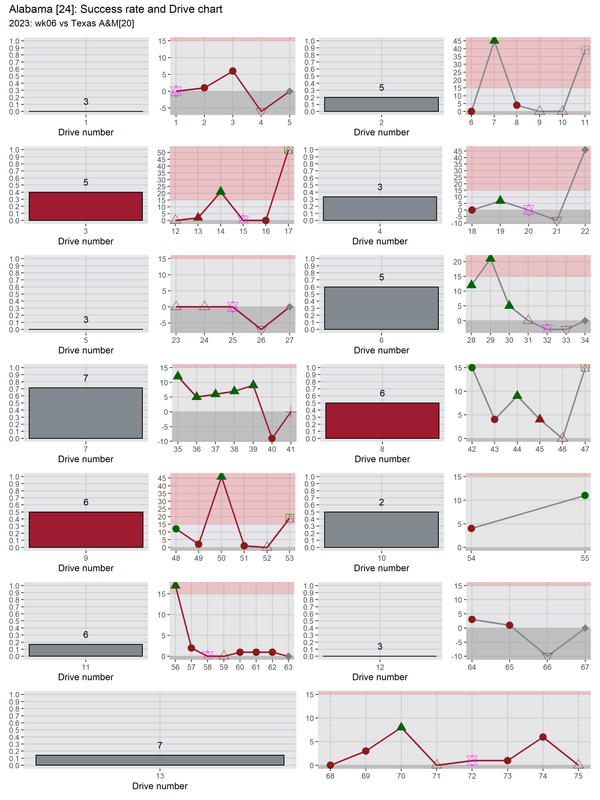
Our SR by Drive mean was a little lower than our season mean 0.312 vs 0.388 (this no longer includes this weeks value). This makes sense given how good everyone was saying TAMUs defense is. Sadly our best drive SR-wise (0.71) with 7 plays ended in a turnover! TAMU's SR by Drive mean was down from a season mean of 0.449 to 0.286 (again this no longer includes this weeks result.) I'm going to go out in a limb and say our defense is a beast!

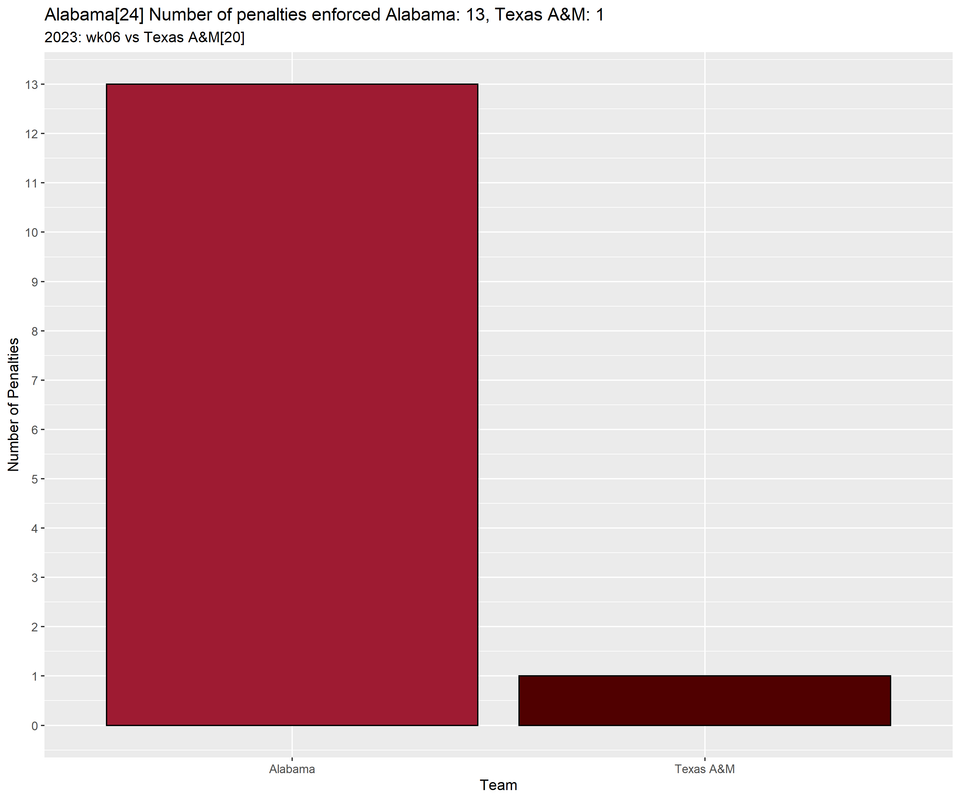
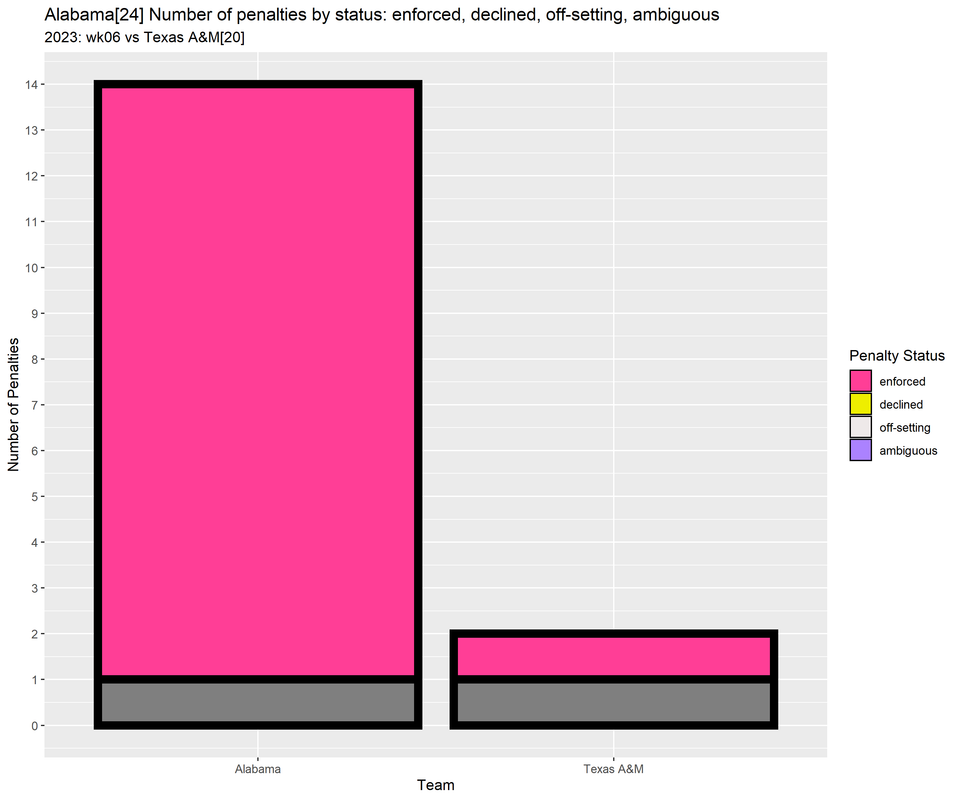
Let's talk penalties. How we won that game with that many penalties is impressive (but not in a totally good sense). My code is being finicky about the penalties this week so the bar graphs are not accurate, but the table below does as good as any graph this week... it was bad! We committed 15 penalties of which 14 were enforced (8 False Starts) and TAMU only committed 4 enforced penalties and one offsetting. I was not impressed with the refs this game. I can handle a poorly officiated game if it is poorly officiated the same way for both teams. We've got to get this under control.
The biggest thing I noted about penalties aren't shown in any of my tables or graphs and it is that we didn't commit a single penalty in the 3rd quarter!
Penalties: 2023, week 06
| Team | Type | Status |
|---|---|---|
| Alabama | False Start | enforced |
| Alabama | False Start | enforced |
| Alabama | False Start | enforced |
| Alabama | Unsportsmanlike Conduct | enforced |
| Alabama | Unsportsmanlike Conduct | offsetting |
| Alabama | False Start | enforced |
| Alabama | Pass Interference | enforced |
| Alabama | Snap Infraction | enforced |
| Alabama | Crackback | enforced |
| Alabama | False Start | enforced |
| Alabama | False Start | enforced |
| Alabama | False Start | enforced |
| Alabama | Defensive Holding | enforced |
| Alabama | Roughing the Passer | enforced |
| Alabama | False Start | enforced |
| Texas A&M | Illegal Participation | enforced |
| Texas A&M | Unsportsmanlike Conduct | offsetting |
| Texas A&M | False Start | enforced |
| Texas A&M | Intentional Grounding | enforced |
| Texas A&M | Holding | enforced |
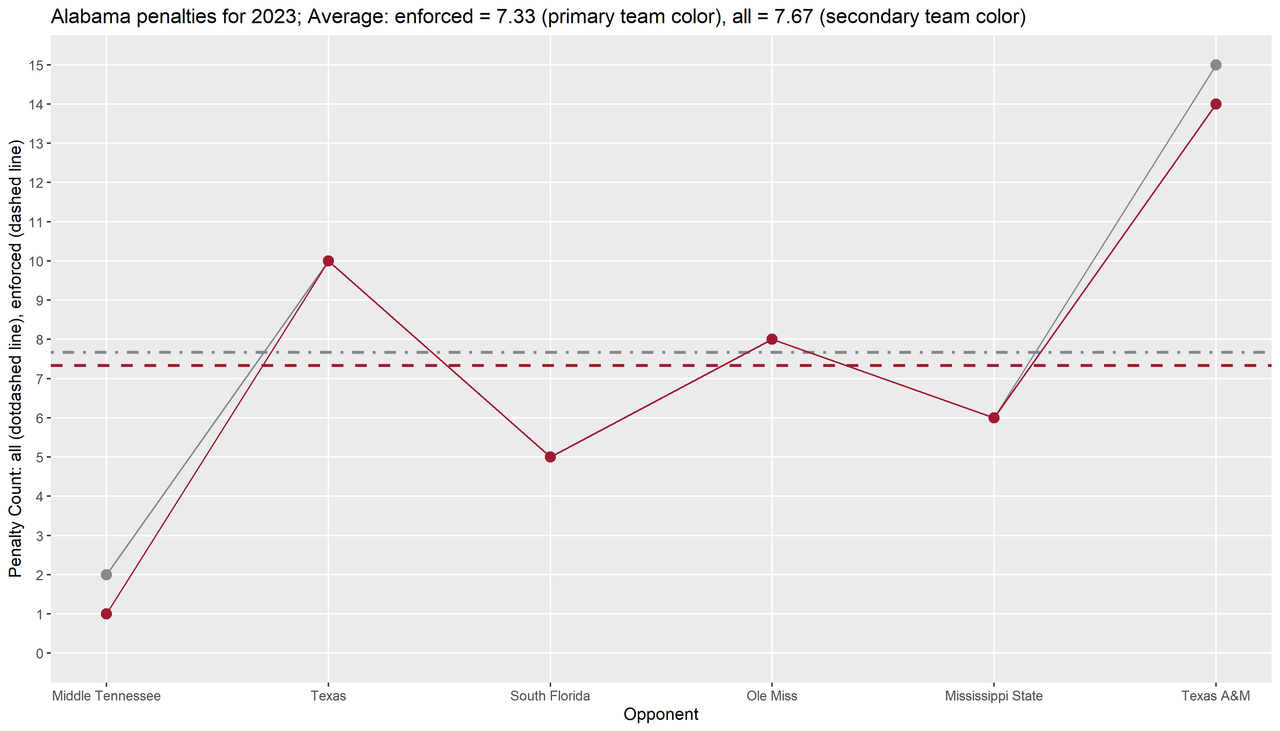
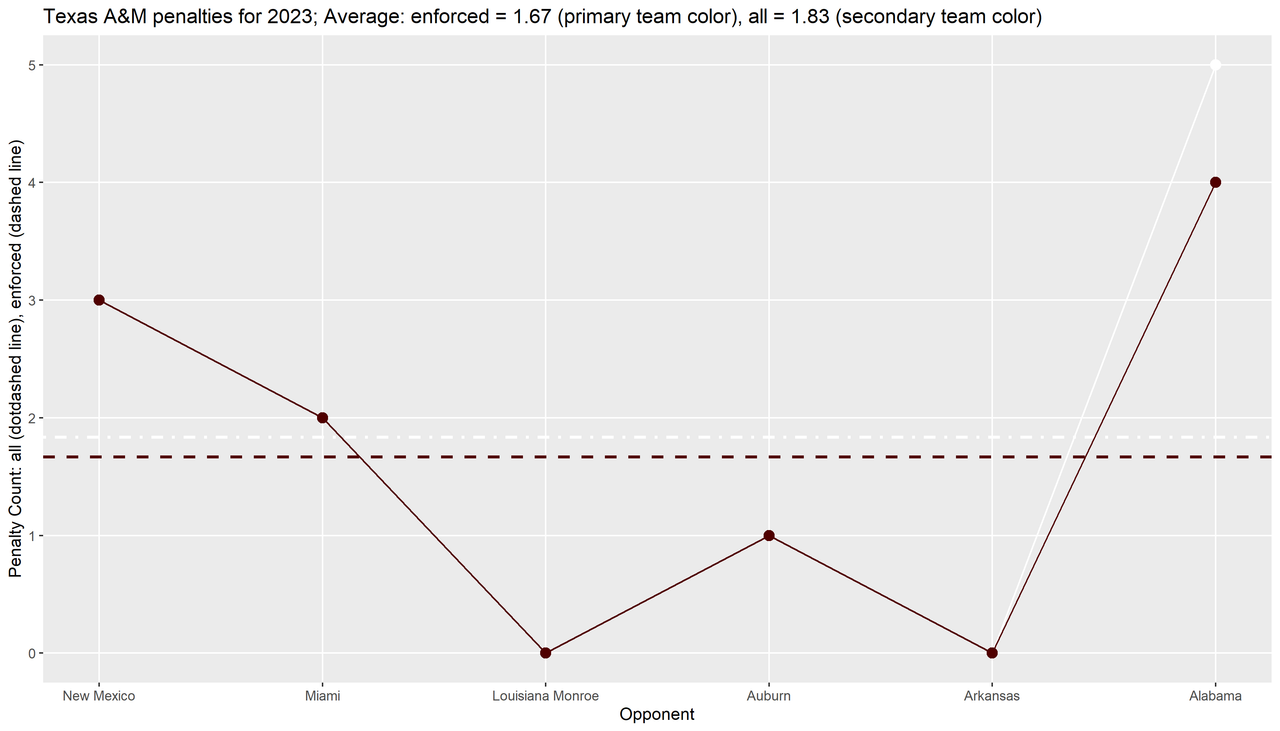
These line graphs are interesting. If I had to guess, while the blow-up between Saban and Fisher has died down in the media it was still there behind the scenes. Below you can see that our z-score has jumped from -0.25 last week to 0.71 within the SEC and nationally we went from a z-score of -0.16 to 1.03!
SEC
| week | Alabama | Arkansas | Auburn | Florida | Georgia | Kentucky | LSU | Mississippi State | Missouri | Ole Miss | South Carolina | Tennessee | Texas A&M | Vanderbilt |
|---|---|---|---|---|---|---|---|---|---|---|---|---|---|---|
| 0 | missing | missing | missing | missing | missing | missing | missing | missing | missing | missing | missing | missing | missing | 8 |
| 1 | 2 | 7 | 4 | 9 | 5 | 7 | 2 | 1 | 7 | 7 | 6 | 4 | 9 | missing |
| 2 | 10 | 4 | 7 | 4 | 3 | 10 | 2 | 9 | 5 | 5 | 8 | 10 | 7 | 5 |
| 3 | 5 | 14 | 5 | 5 | 6 | 5 | 6 | 4 | 6 | 5 | 11 | 10 | 8 | 2 |
| 4 | 6 | 11 | 10 | 5 | 5 | 10 | 5 | 5 | 7 | 8 | 4 | 5 | 7 | 7 |
| 5 | 6 | 0 | 1 | 10 | 3 | 3 | 6 | 3 | 9 | 11 | 4 | 7 | 6 | 4 |
| 6 | 14 | 10 | missing | 8 | 6 | 5 | 12 | 6 | 10 | 5 | missing | missing | 4 | 5 |
| school | sum | mean | z |
|---|---|---|---|
| Arkansas | 46 | 7.67 | 1.13 |
| Missouri | 44 | 7.33 | 0.85 |
| Tennessee | 36 | 7.20 | 0.67 |
| Alabama | 43 | 7.17 | 0.71 |
| Florida | 41 | 6.83 | 0.43 |
| Ole Miss | 41 | 6.83 | 0.43 |
| Texas A&M | 41 | 6.83 | 0.43 |
| Kentucky | 40 | 6.67 | 0.29 |
| South Carolina | 33 | 6.60 | 0.21 |
| LSU | 33 | 5.50 | -0.69 |
| Auburn | 27 | 5.40 | -0.71 |
| Vanderbilt | 31 | 5.17 | -0.97 |
| Georgia | 28 | 4.67 | -1.39 |
| Mississippi State | 28 | 4.67 | -1.39 |
Well that's all the observations for this game. Roll Tide!

Success by drive: Alabama, 2023, week 06, Opponent: Texas A&M
| Drive number | Total | Successful | Unsuccessful | Success rate | Score/Turnover drive |
|---|---|---|---|---|---|
| 1 | 3 | 0 | 3 | 0.0 | Neither |
| 2 | 5 | 1 | 4 | 0.2 | Neither |
| 3 | 5 | 2 | 3 | 0.4 | Score |
| 4 | 3 | 1 | 2 | 0.333333 | Neither |
| 5 | 3 | 0 | 3 | 0.0 | Neither |
| 6 | 5 | 3 | 2 | 0.6 | Neither |
| 7 | 7 | 5 | 2 | 0.714286 | Turnover |
| 8 | 6 | 3 | 3 | 0.5 | Score |
| 9 | 6 | 3 | 3 | 0.5 | Score |
| 10 | 2 | 1 | 1 | 0.5 | Neither |
| 11 | 6 | 1 | 5 | 0.166667 | Neither |
| 12 | 3 | 0 | 3 | 0.0 | Neither |
| 13 | 7 | 1 | 6 | 0.142857 | Neither |
Mean drive SR by week: Alabama, 2023, week 06, Opponent: Texas A&M
| Week | Drive SR: mean |
|---|---|
| wk01 | 0.544988 |
| wk02 | 0.28649 |
| wk03 | 0.336427 |
| wk04 | 0.362338 |
| wk05 | 0.395041 |


Success by down: Alabama, 2023, week 06, Opponent: Texas A&M
| Down | Successful | Unsuccessful | Total | TD/1st |
|---|---|---|---|---|
| 1 | 9 | 17 | 26 | 6 |
| 2 | 8 | 12 | 20 | 7 |
| 3 | 4 | 10 | 14 | 4 |
| 4 | 0 | 1 | 1 | 0 |
3rd down Successful/Unsuccessful: Alabama, 2023, week 06, Opponent: Texas A&M
| Distance | Yards to goal | Successful |
|---|---|---|
| 6 | 21 | Unsuccessful |
| 6 | 64 | Unsuccessful |
| 7 | 45 | Successful |
| 8 | 79 | Unsuccessful |
| 8 | 82 | Unsuccessful |
| 9 | 19 | Successful |
| 10 | 42 | Unsuccessful |
| 12 | 68 | Successful |
| 14 | 15 | Successful |
| 14 | 41 | Unsuccessful |
| 15 | 80 | Unsuccessful |
| 23 | 59 | Unsuccessful |
| 23 | 59 | Unsuccessful |
| 23 | 59 | Unsuccessful |
Distance to 1st/TD, Yards gained statistics by down: Alabama, 2023, week 06, Opponent: Texas A&M
| Down | Count | Δ_plays | Mean distance | Std distance | Median distance | Mean gained | Std gained | Median gained |
|---|---|---|---|---|---|---|---|---|
| 1 | 26 | 0 | 10.3846 | 1.35873 | 10.0 | 4.69231 | 6.56518 | 3.5 |
| 2 | 20 | 6 | 9.75 | 4.17858 | 10.0 | 9.9 | 16.7077 | 2.5 |
| 3 | 14 | 6 | 12.7143 | 6.2932 | 11.0 | 2.71429 | 9.94159 | 1.0 |
| 4 | 1 | 13 | 8.0 | NaN | 8.0 | 0.0 | NaN | 0.0 |


Penalties: 2023, week 06
| Team | Type | Status |
|---|---|---|
| Alabama | False Start | enforced |
| Alabama | False Start | enforced |
| Alabama | False Start | enforced |
| Alabama | Unsportsmanlike Conduct | enforced |
| Alabama | Unsportsmanlike Conduct | offsetting |
| Alabama | False Start | enforced |
| Alabama | Pass Interference | enforced |
| Alabama | Snap Infraction | enforced |
| Alabama | False Start | enforced |
| Alabama | False Start | enforced |
| Alabama | False Start | enforced |
| Alabama | Defensive Holding | enforced |
| Alabama | Roughing the Passer | enforced |
| Alabama | False Start | enforced |
| Texas A&M | Holding | enforced |
| Texas A&M | Unsportsmanlike Conduct | offsetting |

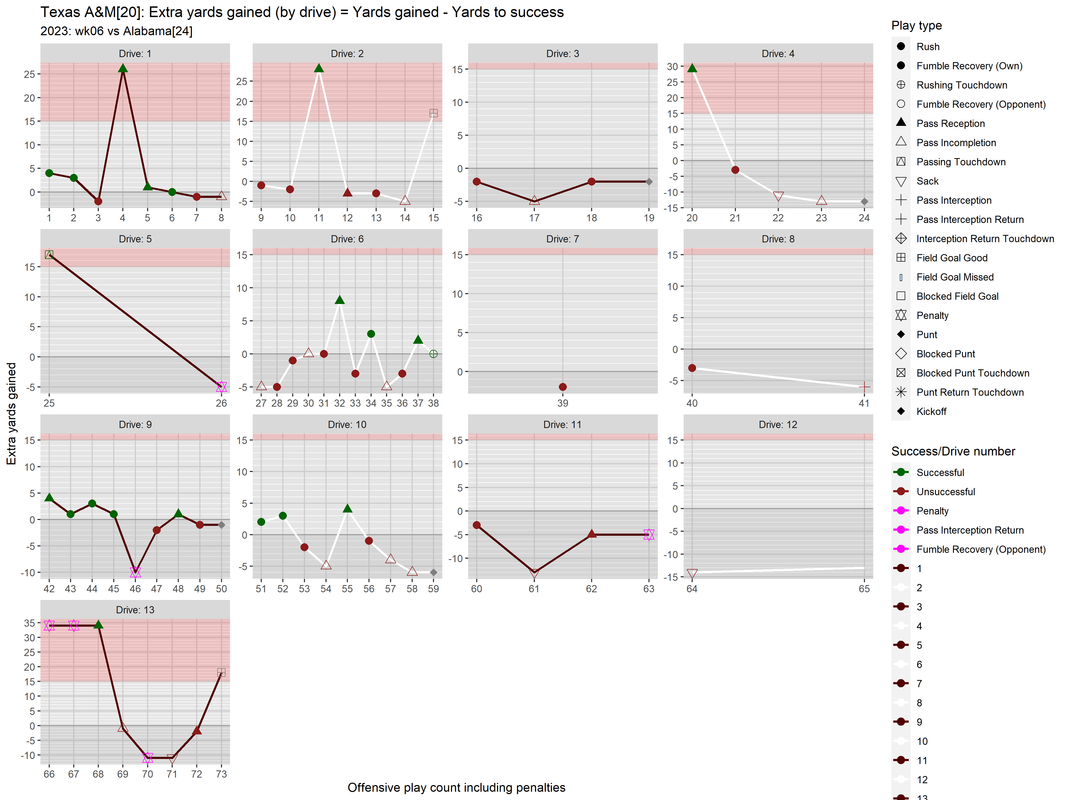
Success by drive: Texas A&M, 2023, week 06, Opponent: Alabama
| Drive number | Total | Successful | Unsuccessful | Success rate | Score/Turnover drive |
|---|---|---|---|---|---|
| 1 | 8 | 5 | 3 | 0.625 | Neither |
| 2 | 6 | 1 | 5 | 0.166667 | Neither |
| 3 | 3 | 0 | 3 | 0.0 | Neither |
| 4 | 4 | 1 | 3 | 0.25 | Neither |
| 5 | 1 | 1 | 0 | 1.0 | Neither |
| 6 | 12 | 4 | 8 | 0.333333 | Score |
| 7 | 1 | 0 | 1 | 0.0 | Neither |
| 8 | 2 | 0 | 2 | 0.0 | Turnover |
| 9 | 7 | 5 | 2 | 0.714286 | Neither |
| 10 | 8 | 3 | 5 | 0.375 | Neither |
| 11 | 3 | 0 | 3 | 0.0 | Neither |
| 12 | 2 | 0 | 2 | 0.0 | Neither |
| 13 | 4 | 1 | 3 | 0.25 | Neither |
Mean drive SR by week: Texas A&M, 2023, week 06, Opponent: Alabama
| Week | Drive SR: mean |
|---|---|
| wk01 | 0.428211 |
| wk02 | 0.368638 |
| wk03 | 0.612229 |
| wk04 | 0.451768 |
| wk05 | 0.411806 |


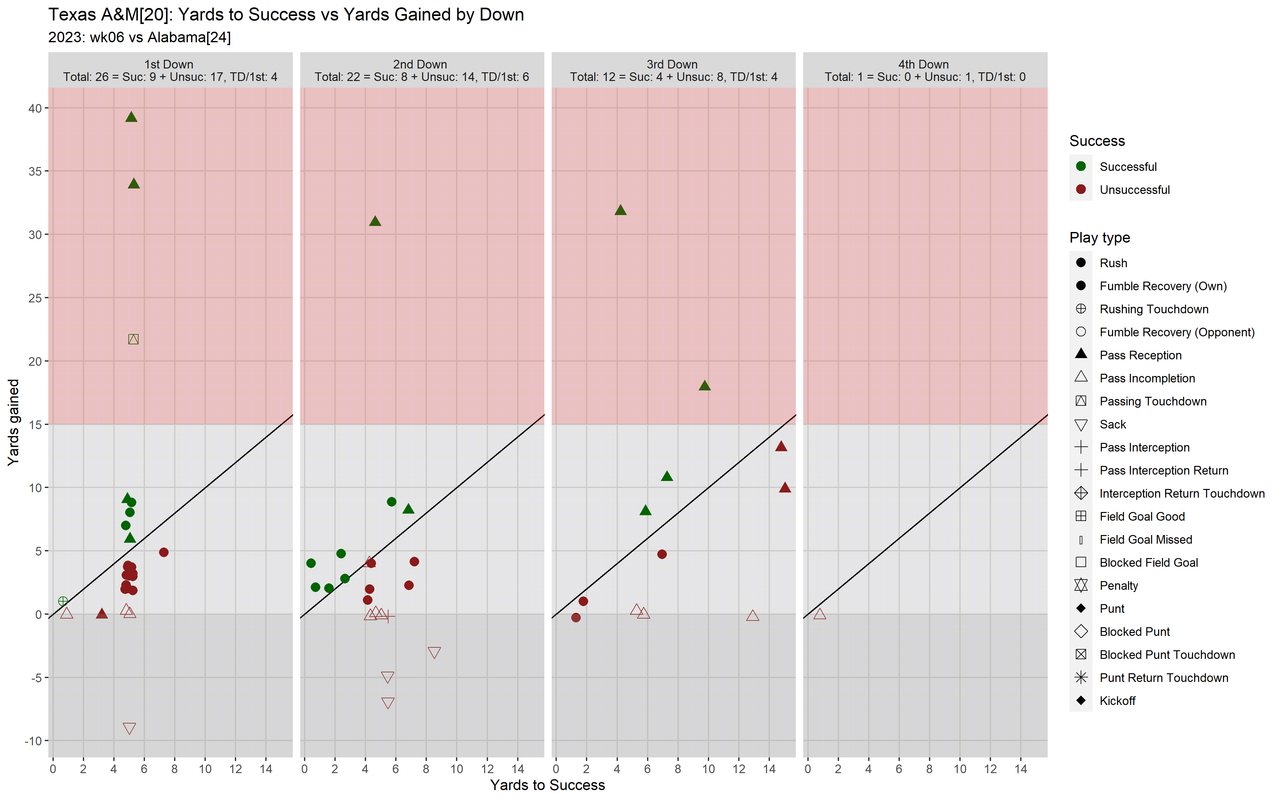
Success by down: Texas A&M, 2023, week 06, Opponent: Alabama
| Down | Successful | Unsuccessful | Total | TD/1st |
|---|---|---|---|---|
| 1 | 9 | 17 | 26 | 4 |
| 2 | 8 | 14 | 22 | 6 |
| 3 | 4 | 8 | 12 | 4 |
| 4 | 0 | 1 | 1 | 0 |
3rd down Successful/Unsuccessful: Texas A&M, 2023, week 06, Opponent: Alabama
| Distance | Yards to goal | Successful |
|---|---|---|
| 1 | 19 | Unsuccessful |
| 2 | 46 | Unsuccessful |
| 4 | 38 | Successful |
| 5 | 5 | Unsuccessful |
| 6 | 9 | Successful |
| 6 | 45 | Unsuccessful |
| 7 | 60 | Successful |
| 7 | 78 | Unsuccessful |
| 10 | 42 | Successful |
| 13 | 48 | Unsuccessful |
| 15 | 15 | Unsuccessful |
| 15 | 34 | Unsuccessful |
Distance to 1st/TD, Yards gained statistics by down: Texas A&M, 2023, week 06, Opponent: Alabama
| Down | Count | Δ_plays | Mean distance | Std distance | Median distance | Mean gained | Std gained | Median gained |
|---|---|---|---|---|---|---|---|---|
| 1 | 26 | 0 | 9.38462 | 2.65446 | 10.0 | 6.26923 | 10.3094 | 3.0 |
| 2 | 22 | 4 | 7.04545 | 3.94579 | 7.0 | 3.0 | 7.25718 | 2.0 |
| 3 | 12 | 10 | 7.58333 | 4.7186 | 6.5 | 8.16667 | 9.66562 | 6.5 |
| 4 | 1 | 11 | 1.0 | NaN | 1.0 | 0.0 | NaN | 0.0 |


Penalties: 2023, week 06
| Team | Type | Status |
|---|---|---|
| Alabama | False Start | enforced |
| Alabama | False Start | enforced |
| Alabama | False Start | enforced |
| Alabama | Unsportsmanlike Conduct | enforced |
| Alabama | Unsportsmanlike Conduct | offsetting |
| Alabama | False Start | enforced |
| Alabama | Pass Interference | enforced |
| Alabama | Snap Infraction | enforced |
| Alabama | False Start | enforced |
| Alabama | False Start | enforced |
| Alabama | False Start | enforced |
| Alabama | Defensive Holding | enforced |
| Alabama | Roughing the Passer | enforced |
| Alabama | False Start | enforced |
| Texas A&M | Holding | enforced |
| Texas A&M | Unsportsmanlike Conduct | offsetting |
All SEC teams
All data below includes intra-conference games and OOC games.
Summary statistics for FBS conferences
| Group | Mean | Stdev | Min | Q1 | Median | Q3 | Max |
|---|---|---|---|---|---|---|---|
| FBS | 5.98 | 2.82 | 0 | 4.0 | 6.0 | 8.0 | 18 |
| ACC | 6.36 | 3.12 | 0 | 4.25 | 6.0 | 8.0 | 18 |
| American Athletic | 5.67 | 2.82 | 0 | 4.0 | 5.0 | 7.0 | 14 |
| Big 12 | 5.36 | 2.48 | 0 | 4.0 | 5.0 | 7.0 | 11 |
| Big Ten | 5.04 | 2.79 | 0 | 3.5 | 5.0 | 7.0 | 11 |
| Conference USA | 6.48 | 2.56 | 2 | 4.75 | 6.0 | 8.0 | 13 |
| FBS Independents | 6.16 | 3.26 | 0 | 4.0 | 6.0 | 8.0 | 12 |
| Mid-American | 5.99 | 2.56 | 1 | 4.0 | 6.0 | 8.0 | 12 |
| Mountain West | 5.95 | 3.32 | 1 | 3.0 | 5.0 | 8.0 | 17 |
| Pac-12 | 6.64 | 2.91 | 2 | 5.0 | 6.5 | 8.75 | 14 |
| SEC | 6.32 | 2.92 | 0 | 5.0 | 6.0 | 8.0 | 14 |
| Sun Belt | 5.95 | 2.72 | 2 | 4.0 | 5.0 | 8.0 | 14 |
ACC
| week | Boston College | Clemson | Duke | Florida State | Georgia Tech | Louisville | Miami | NC State | North Carolina | Pittsburgh | Syracuse | Virginia | Virginia Tech | Wake Forest |
|---|---|---|---|---|---|---|---|---|---|---|---|---|---|---|
| 0 | missing | missing | missing | missing | missing | missing | missing | missing | missing | missing | missing | missing | missing | missing |
| 1 | 10 | 1 | 7 | 7 | 2 | 7 | 8 | 1 | 7 | 7 | 7 | 2 | 4 | 4 |
| 2 | 10 | 4 | 4 | 3 | 3 | 7 | 10 | 8 | 5 | 5 | 9 | 8 | 3 | 3 |
| 3 | 18 | 5 | 1 | 5 | 0 | 6 | 5 | 6 | 5 | 9 | 9 | 7 | 7 | 6 |
| 4 | 7 | 6 | 8 | 7 | 14 | 4 | 7 | 7 | 3 | 11 | 6 | 7 | 9 | 2 |
| 5 | 5 | 6 | 2 | missing | 6 | 10 | missing | 10 | missing | 9 | 9 | 11 | 10 | missing |
| 6 | 3 | 6 | missing | 12 | 10 | 6 | 6 | 6 | 5 | missing | 7 | 5 | 6 | 3 |
| school | sum | mean | z |
|---|---|---|---|
| Boston College | 53 | 8.83 | 1.94 |
| Pittsburgh | 41 | 8.20 | 1.32 |
| Syracuse | 47 | 7.83 | 1.16 |
| Miami | 36 | 7.20 | 0.60 |
| Florida State | 34 | 6.80 | 0.32 |
| Louisville | 40 | 6.67 | 0.24 |
| Virginia | 40 | 6.67 | 0.24 |
| Virginia Tech | 39 | 6.50 | 0.11 |
| NC State | 38 | 6.33 | -0.02 |
| Georgia Tech | 35 | 5.83 | -0.41 |
| North Carolina | 25 | 5.00 | -0.97 |
| Clemson | 28 | 4.67 | -1.33 |
| Duke | 22 | 4.40 | -1.40 |
| Wake Forest | 18 | 3.60 | -1.98 |
American Athletic
| week | Charlotte | East Carolina | Florida Atlantic | Memphis | Navy | North Texas | Rice | SMU | South Florida | Temple | Tulane | Tulsa | UAB | UT San Antonio |
|---|---|---|---|---|---|---|---|---|---|---|---|---|---|---|
| 0 | missing | missing | missing | missing | missing | missing | missing | missing | missing | missing | missing | missing | missing | missing |
| 1 | 6 | 10 | 3 | 5 | 3 | 2 | 5 | 6 | 11 | 3 | 7 | 4 | 5 | 8 |
| 2 | 6 | 11 | 5 | 3 | 4 | 3 | 4 | 2 | 14 | 7 | 2 | 7 | 4 | 1 |
| 3 | 7 | 11 | 6 | 3 | 2 | 9 | 6 | 7 | 5 | 9 | 4 | 7 | 9 | 5 |
| 4 | 7 | 5 | 6 | 5 | missing | missing | 6 | 4 | 9 | 6 | 9 | 3 | 4 | 5 |
| 5 | 7 | 6 | missing | 5 | 8 | 6 | 10 | 8 | 1 | 3 | 5 | 2 | 3 | missing |
| 6 | missing | missing | missing | missing | 4 | 0 | 6 | missing | 9 | 2 | missing | missing | 11 | 8 |
| school | sum | mean | z |
|---|---|---|---|
| East Carolina | 43 | 8.60 | 2.33 |
| South Florida | 49 | 8.17 | 2.17 |
| Charlotte | 33 | 6.60 | 0.74 |
| Rice | 37 | 6.17 | 0.43 |
| UAB | 36 | 6.00 | 0.29 |
| SMU | 27 | 5.40 | -0.22 |
| Tulane | 27 | 5.40 | -0.22 |
| UT San Antonio | 27 | 5.40 | -0.22 |
| Florida Atlantic | 20 | 5.00 | -0.48 |
| Temple | 30 | 5.00 | -0.58 |
| Tulsa | 23 | 4.60 | -0.85 |
| Memphis | 21 | 4.20 | -1.17 |
| Navy | 21 | 4.20 | -1.17 |
| North Texas | 20 | 4.00 | -1.33 |
Big 12
| week | Baylor | BYU | Cincinnati | Houston | Iowa State | Kansas | Kansas State | Oklahoma | Oklahoma State | TCU | Texas | Texas Tech | UCF | West Virginia |
|---|---|---|---|---|---|---|---|---|---|---|---|---|---|---|
| 0 | missing | missing | missing | missing | missing | missing | missing | missing | missing | missing | missing | missing | missing | missing |
| 1 | 9 | 8 | 7 | 3 | 9 | 3 | 4 | 6 | 5 | 10 | 5 | 7 | 7 | 5 |
| 2 | 5 | 3 | 7 | 6 | 2 | 4 | 5 | 9 | 9 | 5 | 4 | 6 | 4 | 4 |
| 3 | 2 | 7 | 10 | 7 | 5 | 7 | 7 | 7 | 7 | 7 | 6 | 2 | 7 | 4 |
| 4 | 4 | 3 | 2 | 11 | 5 | 7 | 5 | 8 | 3 | 6 | 2 | 9 | 10 | 3 |
| 5 | 4 | 4 | 7 | 4 | 6 | 3 | missing | 5 | missing | 7 | 4 | 1 | 7 | 2 |
| 6 | 0 | missing | missing | missing | 1 | 2 | 4 | 4 | 5 | 6 | 9 | 4 | 5 | missing |
| school | sum | mean | z |
|---|---|---|---|
| TCU | 41 | 6.83 | 1.46 |
| UCF | 40 | 6.67 | 1.29 |
| Cincinnati | 33 | 6.60 | 1.12 |
| Oklahoma | 39 | 6.50 | 1.13 |
| Houston | 31 | 6.20 | 0.76 |
| Oklahoma State | 29 | 5.80 | 0.40 |
| BYU | 25 | 5.00 | -0.32 |
| Kansas State | 25 | 5.00 | -0.32 |
| Texas | 30 | 5.00 | -0.36 |
| Texas Tech | 29 | 4.83 | -0.52 |
| Iowa State | 28 | 4.67 | -0.68 |
| Kansas | 26 | 4.33 | -1.01 |
| Baylor | 24 | 4.00 | -1.34 |
| West Virginia | 18 | 3.60 | -1.59 |
Big Ten
| week | Illinois | Indiana | Iowa | Maryland | Michigan | Michigan State | Minnesota | Nebraska | Northwestern | Ohio State | Penn State | Purdue | Rutgers | Wisconsin |
|---|---|---|---|---|---|---|---|---|---|---|---|---|---|---|
| 0 | missing | missing | missing | missing | missing | missing | missing | missing | missing | missing | missing | missing | missing | missing |
| 1 | 10 | 8 | 7 | 6 | 5 | 8 | 3 | 7 | 3 | 5 | 1 | 4 | 2 | 3 |
| 2 | 6 | 7 | 0 | 4 | 4 | 5 | 2 | 6 | 4 | 6 | 7 | 7 | 5 | 4 |
| 3 | 6 | 4 | 1 | 7 | 1 | 11 | 3 | 5 | 1 | 5 | 7 | 11 | 4 | 8 |
| 4 | 6 | 5 | 4 | 4 | 3 | 6 | 5 | 6 | 8 | 5 | 4 | 7 | 5 | 11 |
| 5 | 9 | 4 | 3 | 4 | 0 | 10 | 1 | 4 | 4 | missing | 6 | 3 | 4 | missing |
| 6 | 3 | missing | 2 | 4 | 1 | missing | 4 | 10 | 8 | 10 | missing | 6 | 4 | 2 |
| school | sum | mean | z |
|---|---|---|---|
| Michigan State | 40 | 8.00 | 2.38 |
| Illinois | 40 | 6.67 | 1.43 |
| Nebraska | 38 | 6.33 | 1.14 |
| Purdue | 38 | 6.33 | 1.14 |
| Ohio State | 31 | 6.20 | 0.93 |
| Indiana | 28 | 5.60 | 0.45 |
| Wisconsin | 28 | 5.60 | 0.45 |
| Penn State | 25 | 5.00 | -0.03 |
| Maryland | 29 | 4.83 | -0.18 |
| Northwestern | 28 | 4.67 | -0.33 |
| Rutgers | 24 | 4.00 | -0.91 |
| Minnesota | 18 | 3.00 | -1.79 |
| Iowa | 17 | 2.83 | -1.94 |
| Michigan | 14 | 2.33 | -2.38 |
Conference USA
| week | Florida International | Jacksonville State | Liberty | Louisiana Tech | Middle Tennessee | New Mexico State | Sam Houston State | UTEP | Western Kentucky |
|---|---|---|---|---|---|---|---|---|---|
| 0 | 5 | 7 | missing | 5 | missing | 6 | missing | 10 | missing |
| 1 | missing | missing | 4 | missing | 9 | missing | 7 | missing | 9 |
| 2 | 6 | 7 | 7 | 8 | 6 | 6 | 2 | 6 | 4 |
| 3 | 8 | missing | 10 | 5 | 12 | 7 | missing | 6 | 3 |
| 4 | 5 | 4 | 4 | 12 | 6 | 3 | 10 | 8 | 3 |
| 5 | missing | 6 | missing | 13 | 7 | missing | 8 | 9 | 8 |
| 6 | 5 | 4 | 8 | 7 | 5 | 4 | 3 | missing | 4 |
| school | sum | mean | z |
|---|---|---|---|
| Louisiana Tech | 50 | 8.33 | 1.78 |
| UTEP | 39 | 7.80 | 1.15 |
| Middle Tennessee | 45 | 7.50 | 0.98 |
| Liberty | 33 | 6.60 | 0.11 |
| Sam Houston State | 30 | 6.00 | -0.42 |
| Florida International | 29 | 5.80 | -0.59 |
| Jacksonville State | 28 | 5.60 | -0.77 |
| New Mexico State | 26 | 5.20 | -1.12 |
| Western Kentucky | 31 | 5.17 | -1.26 |
FBS Independents
| week | Army | Connecticut | Notre Dame | UMass |
|---|---|---|---|---|
| 0 | missing | missing | 4 | 8 |
| 1 | 3 | 6 | 1 | 9 |
| 2 | 4 | 8 | 10 | 7 |
| 3 | 0 | 6 | 8 | 7 |
| 4 | 1 | 4 | 4 | 11 |
| 5 | missing | 9 | 12 | 12 |
| 6 | 5 | 6 | 3 | 6 |
| school | sum | mean | z |
|---|---|---|---|
| UMass | 60 | 8.57 | 1.96 |
| Connecticut | 39 | 6.50 | 0.26 |
| Notre Dame | 42 | 6.00 | -0.13 |
| Army | 13 | 2.60 | -2.44 |
Mid-American
| week | Akron | Ball State | Bowling Green | Buffalo | Central Michigan | Eastern Michigan | Kent State | Miami (OH) | Northern Illinois | Ohio | Toledo | Western Michigan |
|---|---|---|---|---|---|---|---|---|---|---|---|---|
| 0 | missing | missing | missing | missing | missing | missing | missing | missing | missing | 3 | missing | missing |
| 1 | 10 | 4 | 9 | 6 | 7 | 6 | 4 | 5 | 4 | missing | 7 | 3 |
| 2 | 8 | 3 | 6 | 8 | 8 | 8 | 5 | 8 | 7 | 1 | 4 | 9 |
| 3 | 6 | 4 | 2 | 6 | 2 | 10 | 7 | 7 | 2 | 1 | 8 | 8 |
| 4 | 10 | 3 | 12 | 6 | 4 | 3 | 11 | 4 | 5 | 8 | 11 | 5 |
| 5 | 2 | 10 | 10 | 7 | 8 | 4 | 5 | 3 | 5 | missing | 8 | 9 |
| 6 | 4 | 7 | 6 | 5 | 6 | 3 | 5 | 5 | 5 | 7 | 7 | 6 |
| school | sum | mean | z |
|---|---|---|---|
| Bowling Green | 45 | 7.50 | 1.45 |
| Toledo | 45 | 7.50 | 1.45 |
| Akron | 40 | 6.67 | 0.65 |
| Western Michigan | 40 | 6.67 | 0.65 |
| Buffalo | 38 | 6.33 | 0.33 |
| Kent State | 37 | 6.17 | 0.17 |
| Central Michigan | 35 | 5.83 | -0.15 |
| Eastern Michigan | 34 | 5.67 | -0.31 |
| Miami (OH) | 32 | 5.33 | -0.62 |
| Ball State | 31 | 5.17 | -0.78 |
| Northern Illinois | 28 | 4.67 | -1.26 |
| Ohio | 20 | 4.00 | -1.74 |
Mountain West
| week | Air Force | Boise State | Colorado State | Fresno State | Hawai'i | Nevada | New Mexico | San Diego State | UNLV | Utah State | Wyoming |
|---|---|---|---|---|---|---|---|---|---|---|---|
| 0 | missing | missing | missing | missing | 7 | missing | missing | 14 | missing | missing | missing |
| 1 | 2 | 3 | 4 | 7 | missing | 4 | 10 | missing | 6 | 10 | 3 |
| 2 | 2 | 4 | missing | 7 | 11 | 3 | 11 | 4 | 3 | 4 | 3 |
| 3 | 6 | 4 | 17 | 9 | 5 | 3 | 7 | 1 | 10 | 4 | 3 |
| 4 | 4 | 4 | 11 | 3 | 4 | 3 | 6 | 5 | 10 | 9 | 8 |
| 5 | 1 | 3 | 8 | 3 | 6 | 10 | 10 | 5 | 8 | 7 | 6 |
| 6 | missing | 3 | 8 | 8 | missing | missing | missing | missing | missing | 5 | 2 |
| school | sum | mean | z |
|---|---|---|---|
| Colorado State | 48 | 9.60 | 2.46 |
| New Mexico | 44 | 8.80 | 1.92 |
| UNLV | 37 | 7.40 | 0.98 |
| Hawai'i | 33 | 6.60 | 0.44 |
| Utah State | 39 | 6.50 | 0.41 |
| Fresno State | 37 | 6.17 | 0.16 |
| San Diego State | 29 | 5.80 | -0.10 |
| Nevada | 23 | 4.60 | -0.91 |
| Wyoming | 25 | 4.17 | -1.32 |
| Boise State | 21 | 3.50 | -1.81 |
| Air Force | 15 | 3.00 | -1.99 |
Pac-12
| week | Arizona | Arizona State | California | Colorado | Oregon | Oregon State | Stanford | UCLA | USC | Utah | Washington | Washington State |
|---|---|---|---|---|---|---|---|---|---|---|---|---|
| 0 | missing | missing | missing | missing | missing | missing | missing | missing | 8 | missing | missing | missing |
| 1 | 11 | 9 | 8 | 6 | 2 | 9 | 9 | 8 | 8 | 5 | 5 | 3 |
| 2 | 5 | 4 | 4 | 9 | 14 | 2 | 5 | 7 | 8 | 7 | 7 | 8 |
| 3 | 6 | 2 | 6 | 10 | 9 | 4 | 6 | 3 | missing | 5 | 11 | 5 |
| 4 | 5 | 4 | 2 | 12 | 9 | 5 | 6 | 6 | 10 | 4 | 9 | 7 |
| 5 | 8 | 5 | 7 | 7 | 2 | 11 | 4 | missing | 6 | 3 | 12 | missing |
| 6 | 12 | 9 | 2 | 8 | missing | 5 | missing | 8 | 8 | missing | missing | 4 |
| school | sum | mean | z |
|---|---|---|---|
| Washington | 44 | 8.80 | 1.66 |
| Colorado | 52 | 8.67 | 1.71 |
| USC | 48 | 8.00 | 1.15 |
| Arizona | 47 | 7.83 | 1.01 |
| Oregon | 36 | 7.20 | 0.43 |
| UCLA | 32 | 6.40 | -0.18 |
| Oregon State | 36 | 6.00 | -0.54 |
| Stanford | 30 | 6.00 | -0.49 |
| Arizona State | 33 | 5.50 | -0.96 |
| Washington State | 27 | 5.40 | -0.95 |
| California | 29 | 4.83 | -1.52 |
| Utah | 24 | 4.80 | -1.41 |
SEC
| week | Alabama | Arkansas | Auburn | Florida | Georgia | Kentucky | LSU | Mississippi State | Missouri | Ole Miss | South Carolina | Tennessee | Texas A&M | Vanderbilt |
|---|---|---|---|---|---|---|---|---|---|---|---|---|---|---|
| 0 | missing | missing | missing | missing | missing | missing | missing | missing | missing | missing | missing | missing | missing | 8 |
| 1 | 2 | 7 | 4 | 9 | 5 | 7 | 2 | 1 | 7 | 7 | 6 | 4 | 9 | missing |
| 2 | 10 | 4 | 7 | 4 | 3 | 10 | 2 | 9 | 5 | 5 | 8 | 10 | 7 | 5 |
| 3 | 5 | 14 | 5 | 5 | 6 | 5 | 6 | 4 | 6 | 5 | 11 | 10 | 8 | 2 |
| 4 | 6 | 11 | 10 | 5 | 5 | 10 | 5 | 5 | 7 | 8 | 4 | 5 | 7 | 7 |
| 5 | 6 | 0 | 1 | 10 | 3 | 3 | 6 | 3 | 9 | 11 | 4 | 7 | 6 | 4 |
| 6 | 14 | 10 | missing | 8 | 6 | 5 | 12 | 6 | 10 | 5 | missing | missing | 4 | 5 |
| school | sum | mean | z |
|---|---|---|---|
| Arkansas | 46 | 7.67 | 1.13 |
| Missouri | 44 | 7.33 | 0.85 |
| Tennessee | 36 | 7.20 | 0.67 |
| Alabama | 43 | 7.17 | 0.71 |
| Florida | 41 | 6.83 | 0.43 |
| Ole Miss | 41 | 6.83 | 0.43 |
| Texas A&M | 41 | 6.83 | 0.43 |
| Kentucky | 40 | 6.67 | 0.29 |
| South Carolina | 33 | 6.60 | 0.21 |
| LSU | 33 | 5.50 | -0.69 |
| Auburn | 27 | 5.40 | -0.71 |
| Vanderbilt | 31 | 5.17 | -0.97 |
| Georgia | 28 | 4.67 | -1.39 |
| Mississippi State | 28 | 4.67 | -1.39 |
Sun Belt
| week | Appalachian State | Arkansas State | Coastal Carolina | Georgia Southern | Georgia State | James Madison | Louisiana | Louisiana Monroe | Marshall | Old Dominion | South Alabama | Southern Mississippi | Texas State | Troy |
|---|---|---|---|---|---|---|---|---|---|---|---|---|---|---|
| 0 | missing | missing | missing | missing | missing | missing | missing | missing | missing | missing | missing | missing | missing | missing |
| 1 | 2 | 14 | 3 | 9 | 5 | 4 | 2 | 5 | 5 | 4 | 7 | 5 | 4 | 5 |
| 2 | 7 | 3 | 4 | 6 | 2 | 7 | 10 | 3 | 4 | 3 | 6 | 13 | 6 | 3 |
| 3 | 3 | 4 | 3 | 5 | 11 | 6 | 8 | 6 | missing | 5 | 8 | 6 | 10 | 6 |
| 4 | 2 | 3 | 10 | 5 | 9 | 6 | 5 | missing | 3 | 7 | 5 | 5 | 9 | 7 |
| 5 | 6 | 10 | 10 | 10 | 5 | 10 | 7 | 5 | 10 | 9 | 5 | 7 | 8 | 4 |
| 6 | missing | 2 | missing | missing | missing | missing | 5 | 2 | 6 | 5 | 9 | 4 | 3 | 8 |
| school | sum | mean | z |
|---|---|---|---|
| Georgia Southern | 35 | 7.00 | 0.87 |
| South Alabama | 40 | 6.67 | 0.65 |
| Southern Mississippi | 40 | 6.67 | 0.65 |
| Texas State | 40 | 6.67 | 0.65 |
| James Madison | 33 | 6.60 | 0.54 |
| Georgia State | 32 | 6.40 | 0.37 |
| Louisiana | 37 | 6.17 | 0.20 |
| Arkansas State | 36 | 6.00 | 0.05 |
| Coastal Carolina | 30 | 6.00 | 0.04 |
| Marshall | 28 | 5.60 | -0.29 |
| Old Dominion | 33 | 5.50 | -0.40 |
| Troy | 33 | 5.50 | -0.40 |
| Louisiana Monroe | 21 | 4.20 | -1.44 |
| Appalachian State | 20 | 4.00 | -1.60 |
All FBS sorted by z-scores
| school | sum | mean | z |
|---|---|---|---|
| Colorado State | 48 | 9.60 | 2.87 |
| Boston College | 53 | 8.83 | 2.48 |
| New Mexico | 44 | 8.80 | 2.23 |
| Washington | 44 | 8.80 | 2.23 |
| Colorado | 52 | 8.67 | 2.33 |
| East Carolina | 43 | 8.60 | 2.08 |
| UMass | 60 | 8.57 | 2.43 |
| Louisiana Tech | 50 | 8.33 | 2.04 |
| Pittsburgh | 41 | 8.20 | 1.76 |
| South Florida | 49 | 8.17 | 1.90 |
| Michigan State | 40 | 8.00 | 1.60 |
| USC | 48 | 8.00 | 1.75 |
| Arizona | 47 | 7.83 | 1.61 |
| Syracuse | 47 | 7.83 | 1.61 |
| UTEP | 39 | 7.80 | 1.44 |
| Arkansas | 46 | 7.67 | 1.46 |
| Bowling Green | 45 | 7.50 | 1.32 |
| Middle Tennessee | 45 | 7.50 | 1.32 |
| Toledo | 45 | 7.50 | 1.32 |
| UNLV | 37 | 7.40 | 1.12 |
| Missouri | 44 | 7.33 | 1.17 |
| Miami | 36 | 7.20 | 0.97 |
| Oregon | 36 | 7.20 | 0.97 |
| Tennessee | 36 | 7.20 | 0.97 |
| Alabama | 43 | 7.17 | 1.03 |
| Georgia Southern | 35 | 7.00 | 0.81 |
| Florida | 41 | 6.83 | 0.74 |
| Ole Miss | 41 | 6.83 | 0.74 |
| TCU | 41 | 6.83 | 0.74 |
| Texas A&M | 41 | 6.83 | 0.74 |
| Florida State | 34 | 6.80 | 0.65 |
| Akron | 40 | 6.67 | 0.60 |
| Illinois | 40 | 6.67 | 0.60 |
| Kentucky | 40 | 6.67 | 0.60 |
| Louisville | 40 | 6.67 | 0.60 |
| South Alabama | 40 | 6.67 | 0.60 |
| Southern Mississippi | 40 | 6.67 | 0.60 |
| Texas State | 40 | 6.67 | 0.60 |
| UCF | 40 | 6.67 | 0.60 |
| Virginia | 40 | 6.67 | 0.60 |
| Western Michigan | 40 | 6.67 | 0.60 |
| Charlotte | 33 | 6.60 | 0.49 |
| Cincinnati | 33 | 6.60 | 0.49 |
| Hawai'i | 33 | 6.60 | 0.49 |
| James Madison | 33 | 6.60 | 0.49 |
| Liberty | 33 | 6.60 | 0.49 |
| South Carolina | 33 | 6.60 | 0.49 |
| Connecticut | 39 | 6.50 | 0.45 |
| Oklahoma | 39 | 6.50 | 0.45 |
| Utah State | 39 | 6.50 | 0.45 |
| Virginia Tech | 39 | 6.50 | 0.45 |
| Georgia State | 32 | 6.40 | 0.33 |
| UCLA | 32 | 6.40 | 0.33 |
| Buffalo | 38 | 6.33 | 0.31 |
| NC State | 38 | 6.33 | 0.31 |
| Nebraska | 38 | 6.33 | 0.31 |
| Purdue | 38 | 6.33 | 0.31 |
| Houston | 31 | 6.20 | 0.17 |
| Ohio State | 31 | 6.20 | 0.17 |
| Fresno State | 37 | 6.17 | 0.16 |
| Kent State | 37 | 6.17 | 0.16 |
| Louisiana | 37 | 6.17 | 0.16 |
| Rice | 37 | 6.17 | 0.16 |
| Arkansas State | 36 | 6.00 | 0.02 |
| Coastal Carolina | 30 | 6.00 | 0.02 |
| Notre Dame | 42 | 6.00 | 0.02 |
| Oregon State | 36 | 6.00 | 0.02 |
| Sam Houston State | 30 | 6.00 | 0.02 |
| Stanford | 30 | 6.00 | 0.02 |
| UAB | 36 | 6.00 | 0.02 |
| Central Michigan | 35 | 5.83 | -0.13 |
| Georgia Tech | 35 | 5.83 | -0.13 |
| Florida International | 29 | 5.80 | -0.14 |
| Oklahoma State | 29 | 5.80 | -0.14 |
| San Diego State | 29 | 5.80 | -0.14 |
| Eastern Michigan | 34 | 5.67 | -0.27 |
| Indiana | 28 | 5.60 | -0.30 |
| Jacksonville State | 28 | 5.60 | -0.30 |
| Marshall | 28 | 5.60 | -0.30 |
| Wisconsin | 28 | 5.60 | -0.30 |
| Arizona State | 33 | 5.50 | -0.42 |
| LSU | 33 | 5.50 | -0.42 |
| Old Dominion | 33 | 5.50 | -0.42 |
| Troy | 33 | 5.50 | -0.42 |
| Auburn | 27 | 5.40 | -0.46 |
| SMU | 27 | 5.40 | -0.46 |
| Tulane | 27 | 5.40 | -0.46 |
| UT San Antonio | 27 | 5.40 | -0.46 |
| Washington State | 27 | 5.40 | -0.46 |
| Miami (OH) | 32 | 5.33 | -0.56 |
| New Mexico State | 26 | 5.20 | -0.62 |
| Ball State | 31 | 5.17 | -0.71 |
| Vanderbilt | 31 | 5.17 | -0.71 |
| Western Kentucky | 31 | 5.17 | -0.71 |
| BYU | 25 | 5.00 | -0.78 |
| Florida Atlantic | 20 | 5.00 | -0.70 |
| Kansas State | 25 | 5.00 | -0.78 |
| North Carolina | 25 | 5.00 | -0.78 |
| Penn State | 25 | 5.00 | -0.78 |
| Temple | 30 | 5.00 | -0.85 |
| Texas | 30 | 5.00 | -0.85 |
| California | 29 | 4.83 | -1.00 |
| Maryland | 29 | 4.83 | -1.00 |
| Texas Tech | 29 | 4.83 | -1.00 |
| Utah | 24 | 4.80 | -0.94 |
| Clemson | 28 | 4.67 | -1.14 |
| Georgia | 28 | 4.67 | -1.14 |
| Iowa State | 28 | 4.67 | -1.14 |
| Mississippi State | 28 | 4.67 | -1.14 |
| Northern Illinois | 28 | 4.67 | -1.14 |
| Northwestern | 28 | 4.67 | -1.14 |
| Nevada | 23 | 4.60 | -1.09 |
| Tulsa | 23 | 4.60 | -1.09 |
| Duke | 22 | 4.40 | -1.25 |
| Kansas | 26 | 4.33 | -1.43 |
| Louisiana Monroe | 21 | 4.20 | -1.41 |
| Memphis | 21 | 4.20 | -1.41 |
| Navy | 21 | 4.20 | -1.41 |
| Wyoming | 25 | 4.17 | -1.58 |
| Appalachian State | 20 | 4.00 | -1.57 |
| Baylor | 24 | 4.00 | -1.72 |
| North Texas | 20 | 4.00 | -1.57 |
| Ohio | 20 | 4.00 | -1.57 |
| Rutgers | 24 | 4.00 | -1.72 |
| Wake Forest | 18 | 3.60 | -1.89 |
| West Virginia | 18 | 3.60 | -1.89 |
| Boise State | 21 | 3.50 | -2.15 |
| Air Force | 15 | 3.00 | -2.36 |
| Minnesota | 18 | 3.00 | -2.59 |
| Iowa | 17 | 2.83 | -2.73 |
| Army | 13 | 2.60 | -2.68 |
| Michigan | 14 | 2.33 | -3.17 |
Data: @CFB_Data or collegefootballdata.com
Loading comments...