If you would like to see and play with the interactive version of these graphs you can find them at
https://github.com/MCurve7/mcurve7_cfb/tree/main/RBR/2023
You just need to download the Alabama_(year)_regular_wk??_(opponent).html file and open it in a web browser.
Just a few quick notes as I'm still behind at work.
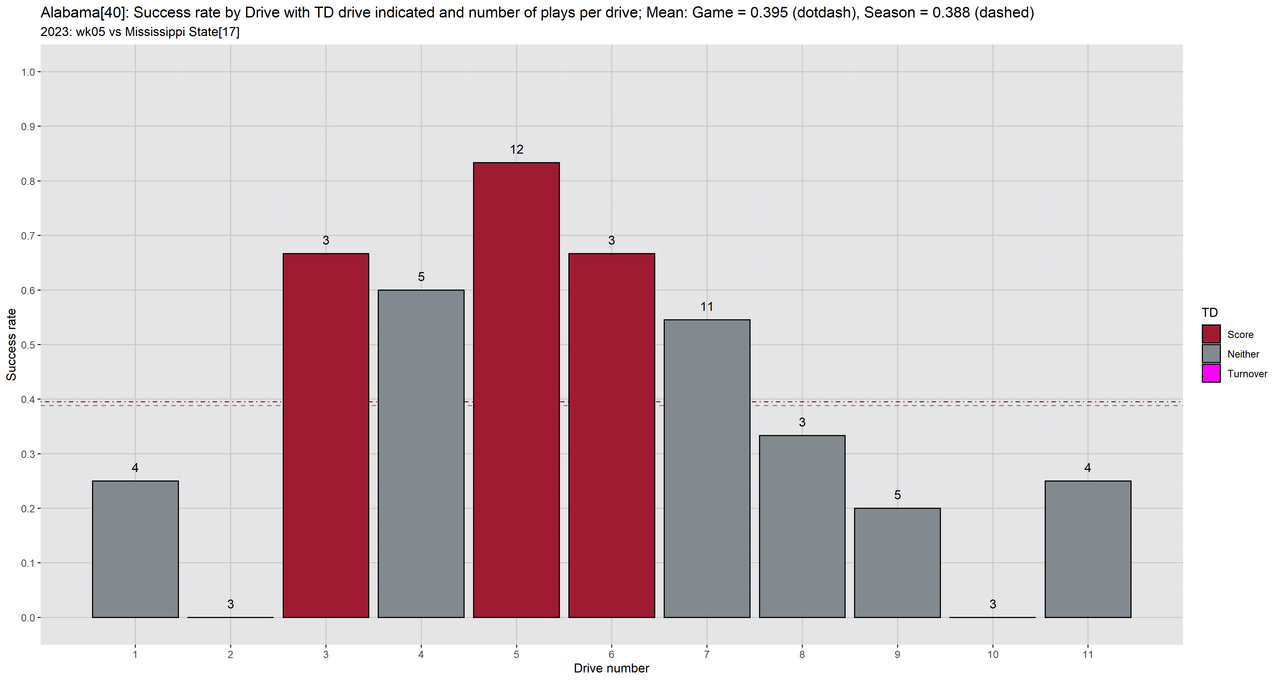
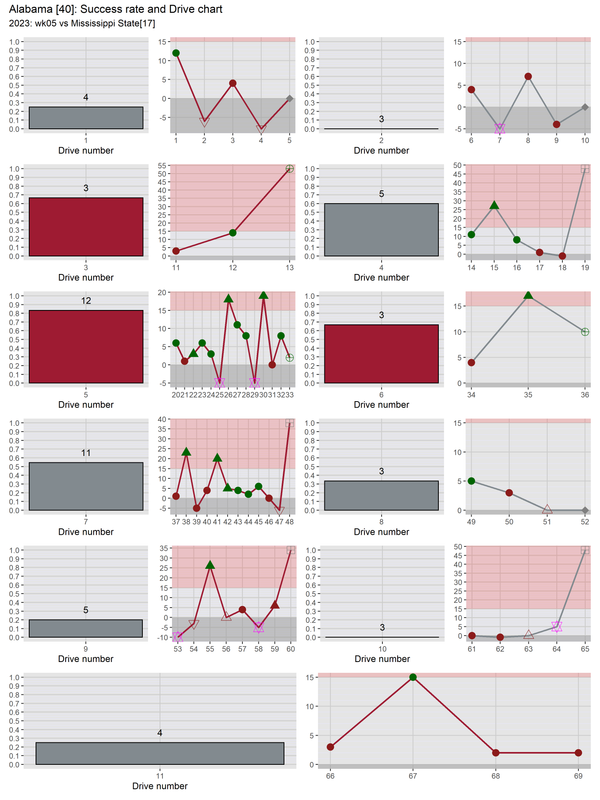
Looking at the SR by Drive our mean Drive SR for this game (0.395) is slightly higher than the season Drive SR (0.388) which includes this game's datum value.
As already pointed out by balloons,
our middle of the game rates (drives 3-7) were looking good with a minimum SR of 0.545
and all ended with a TD or FG.
Success by drive: Alabama, 2023, week 05, Opponent: Mississippi State
| 1 |
4 |
1 |
3 |
0.25 |
Neither |
| 2 |
3 |
0 |
3 |
0.0 |
Neither |
| 3 |
3 |
2 |
1 |
0.666667 |
Score |
| 4 |
5 |
3 |
2 |
0.6 |
Neither |
| 5 |
12 |
10 |
2 |
0.833333 |
Score |
| 6 |
3 |
2 |
1 |
0.666667 |
Score |
| 7 |
11 |
6 |
5 |
0.545455 |
Neither |
| 8 |
3 |
1 |
2 |
0.333333 |
Neither |
| 9 |
5 |
1 |
4 |
0.2 |
Neither |
| 10 |
3 |
0 |
3 |
0.0 |
Neither |
| 11 |
4 |
1 |
3 |
0.25 |
Neither |
Mean drive SR by week: Alabama, 2023, week 05, Opponent: Mississippi State
| wk01 |
0.544988 |
| wk02 |
0.28649 |
| wk03 |
0.336427 |
| wk04 |
0.362338 |
| wk05 |
0.395041 |
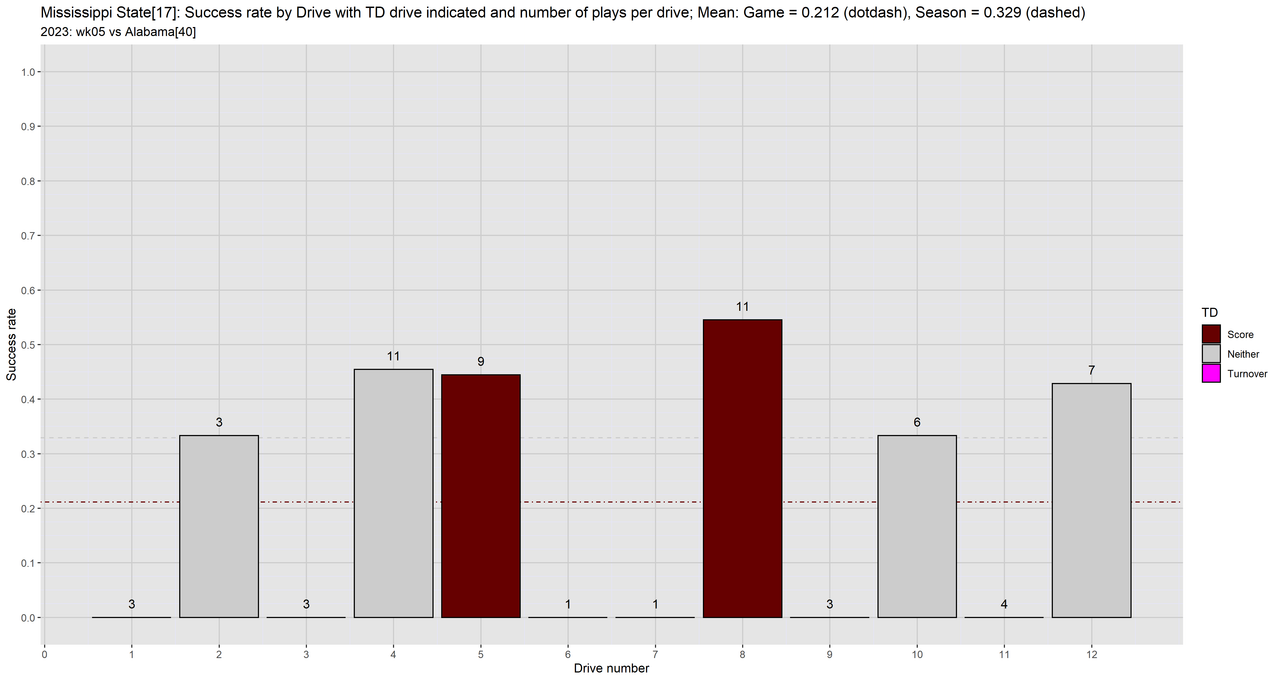
Mississippi State on the other hand had a game Drive SR of 0.212 and a season Drive SR of 0.329
(it occurs to me I shouldn't include the current game data in the season calculation).
Without this game their mean Drive SR was 0.355 and ours was 0.383.
LSU held them to a 0.175 mean Drive SR.
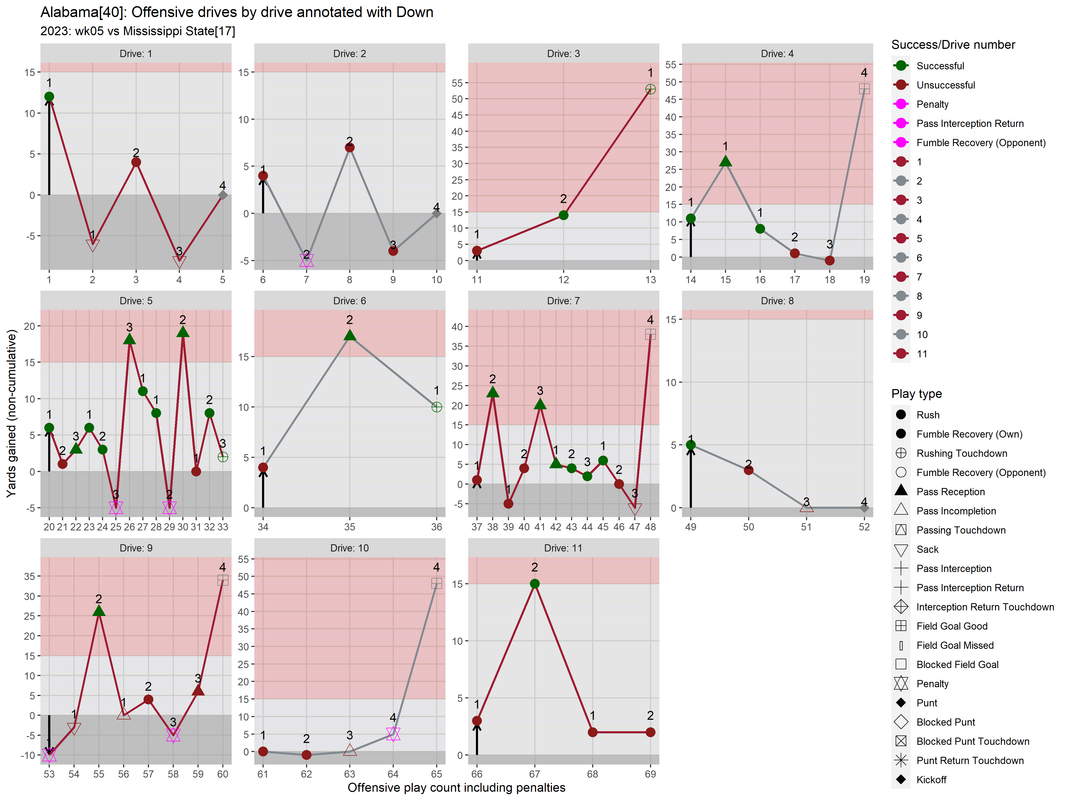
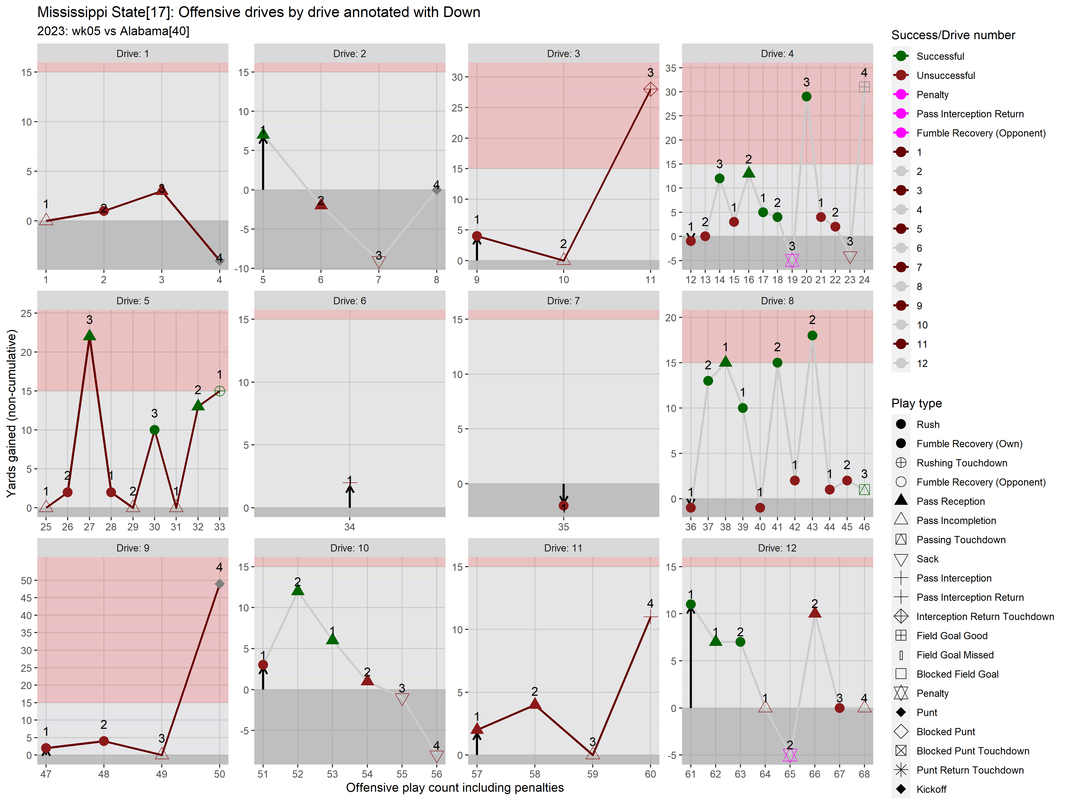
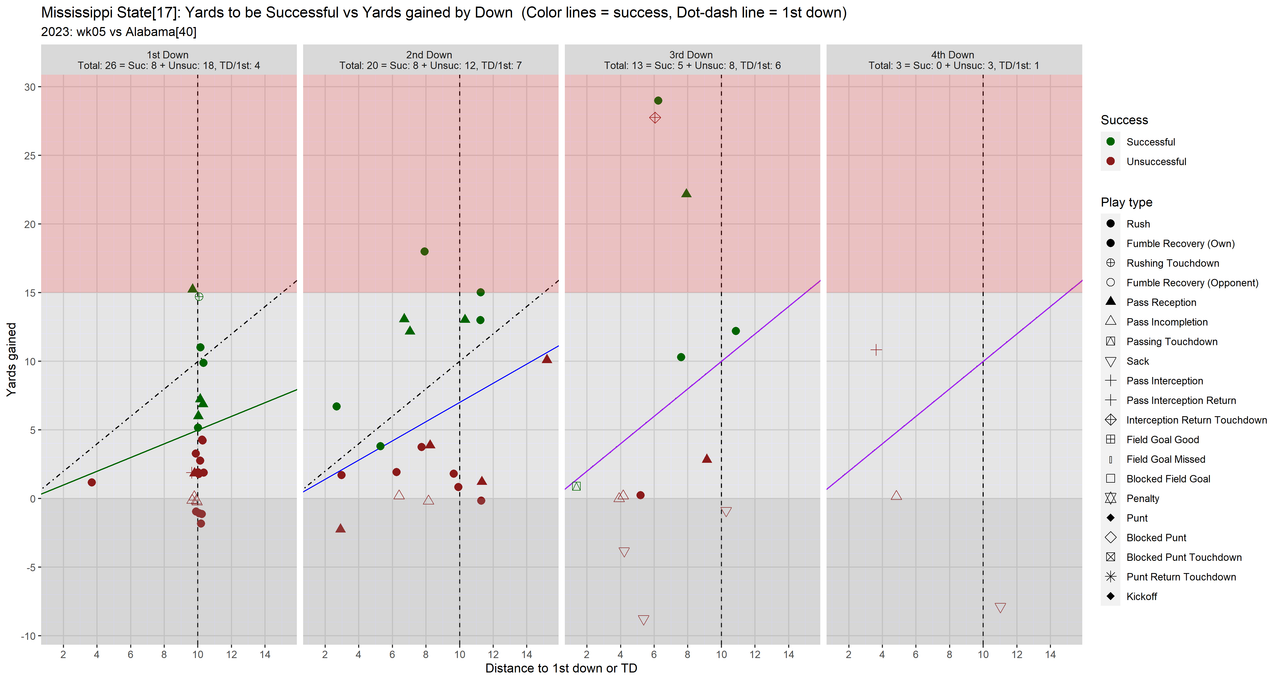
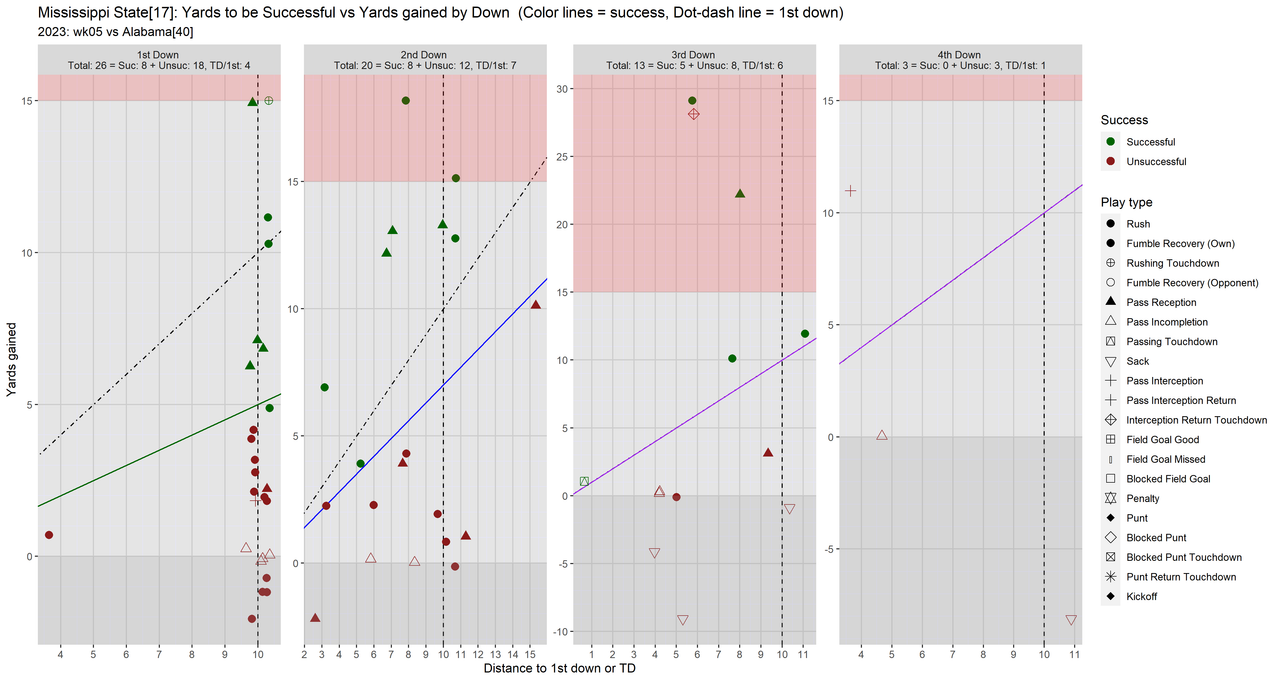
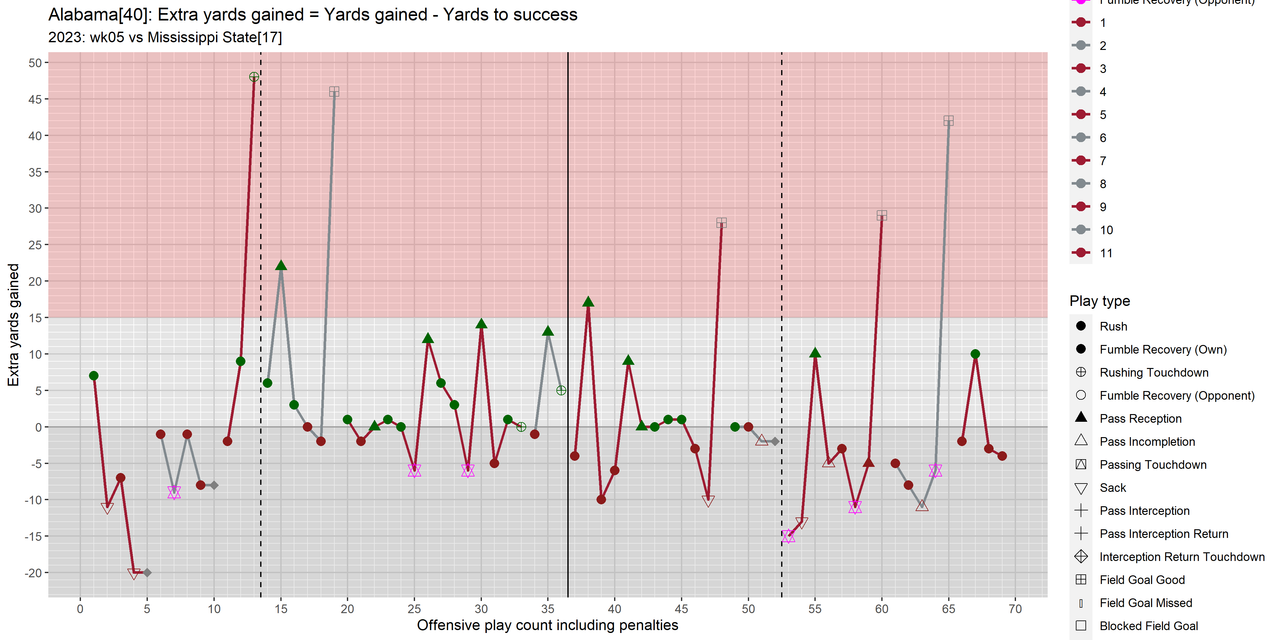
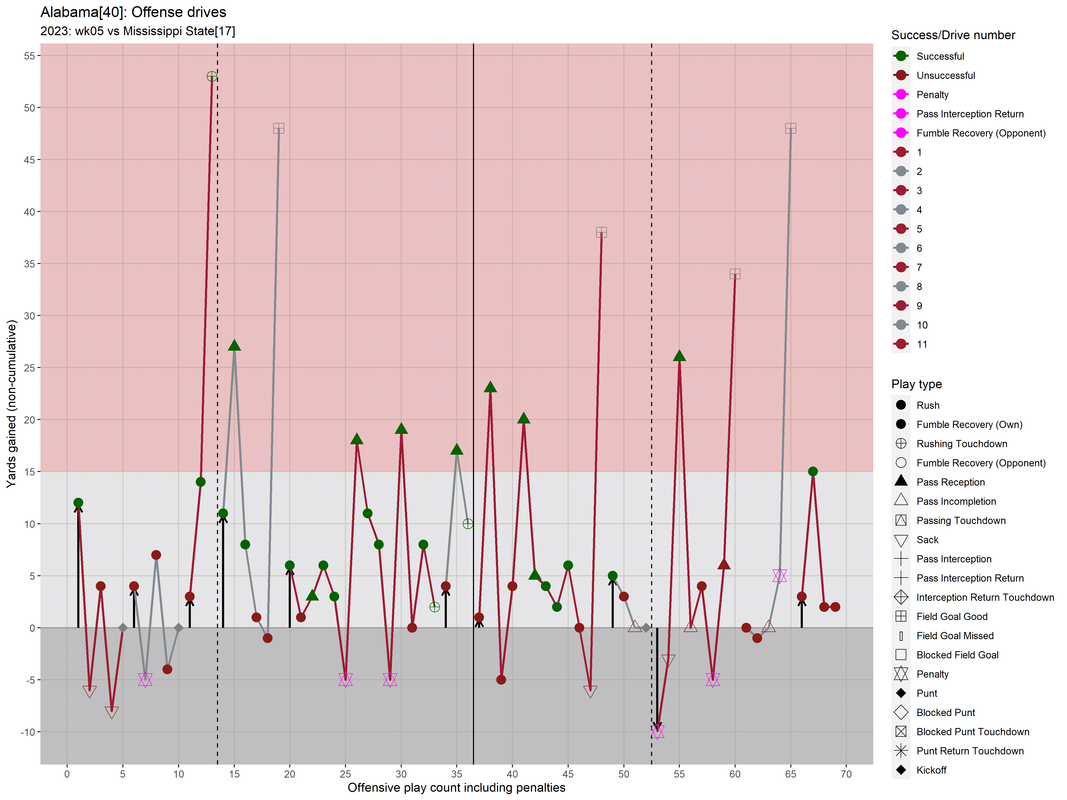
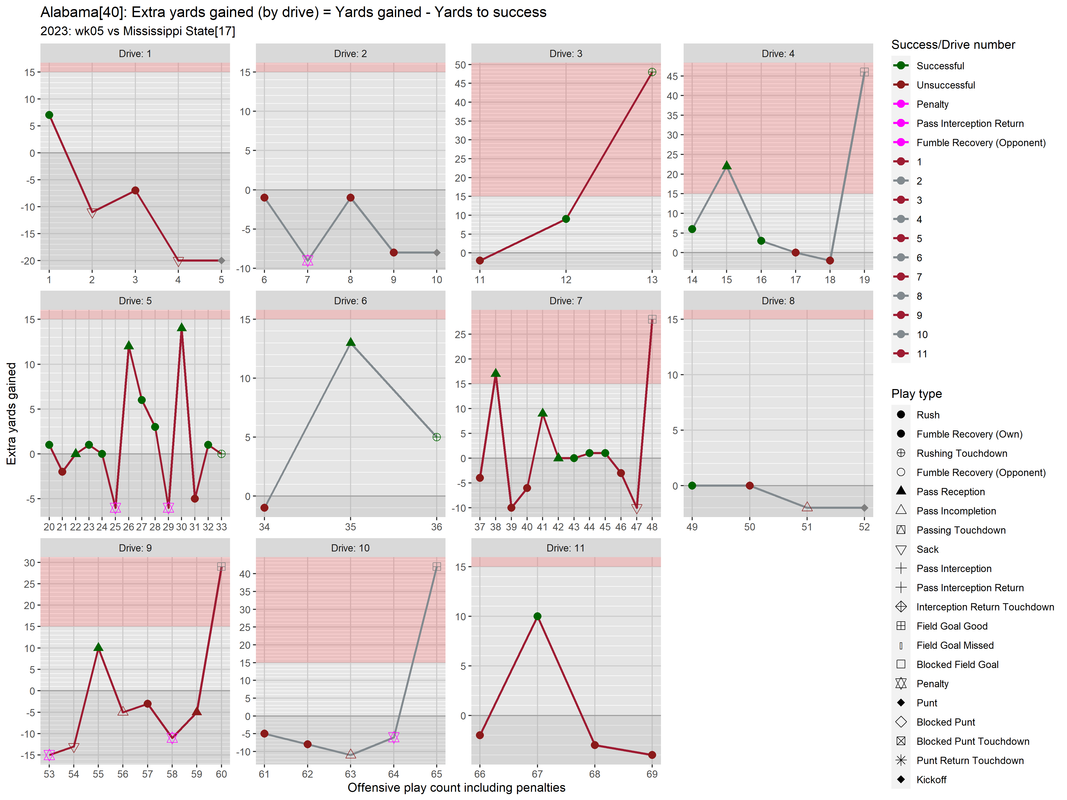
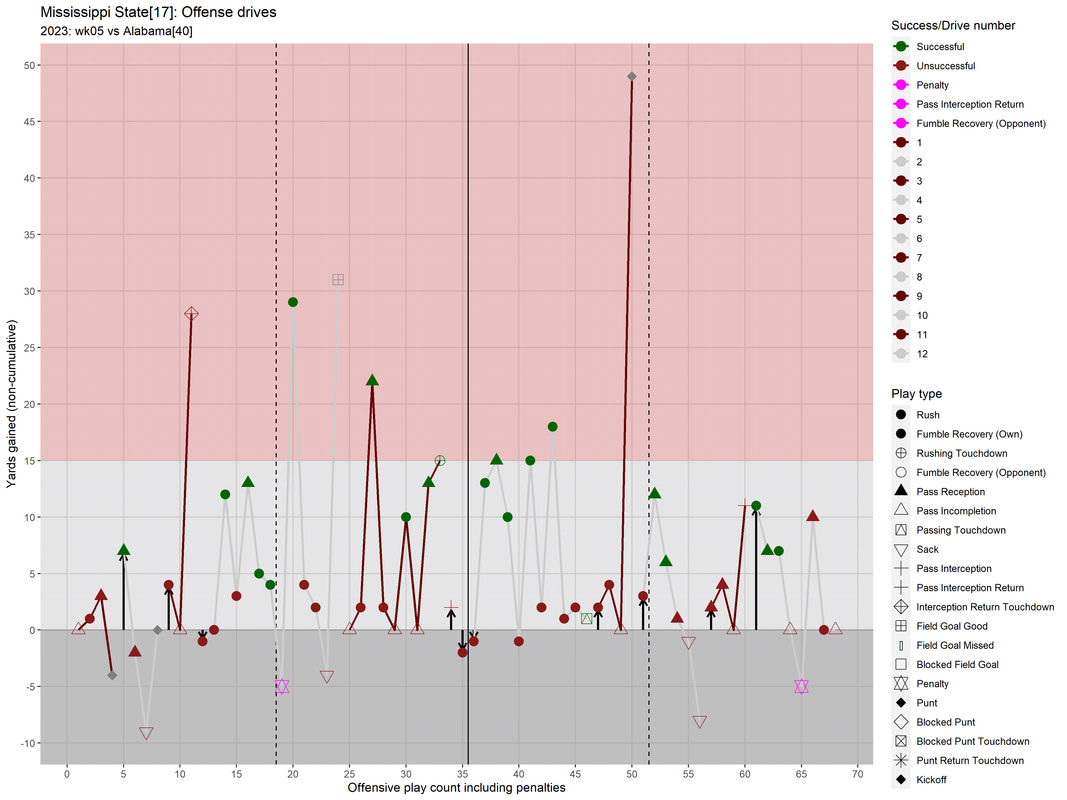
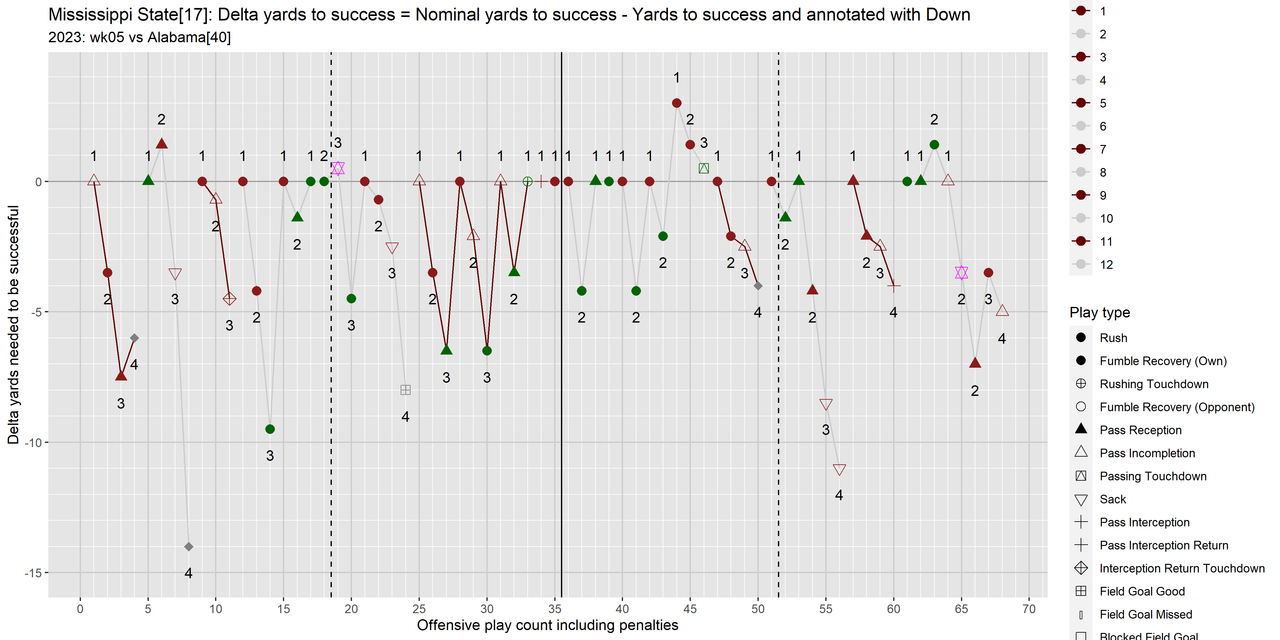
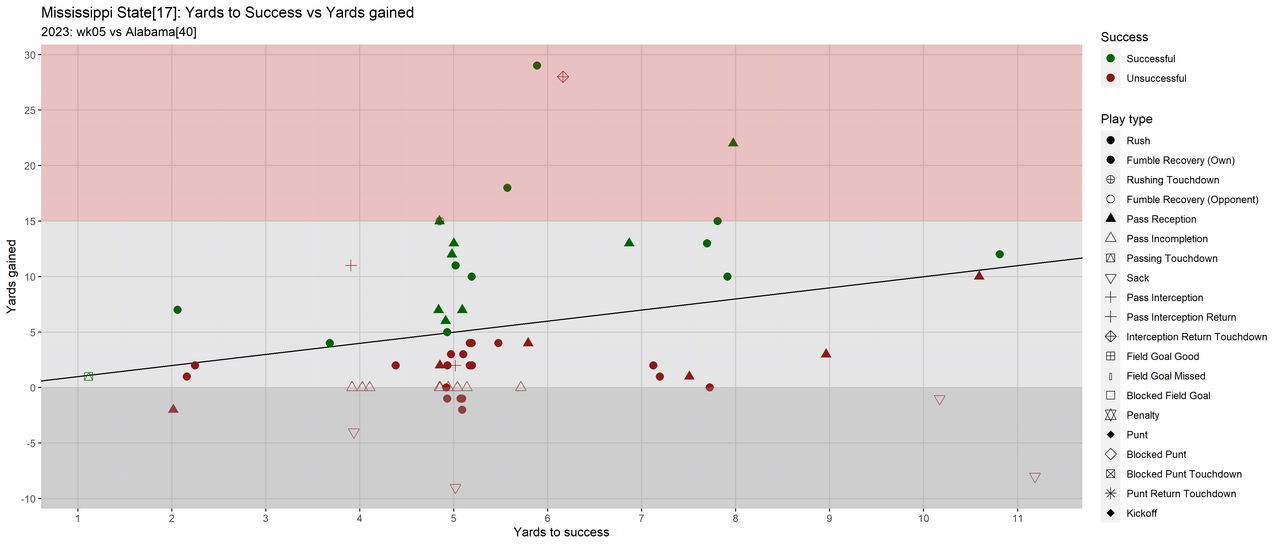
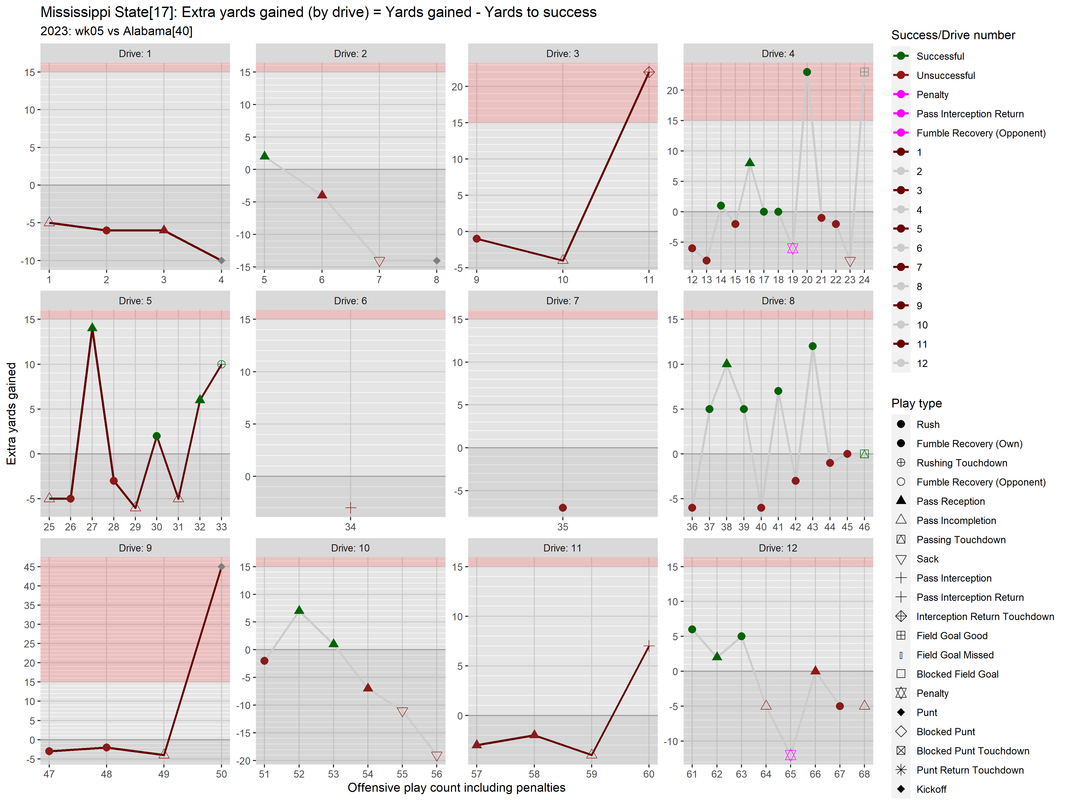
Something that doesn't pop out is the three interceptions since the SR on those drives was 0,
but this can be seen in the Offense drive by drives graph (the plus signs and crossed diamond = pick-6).
They were still able to score TDs even though those drives had SRs of 0.444 and 0.545
Success by drive: Mississippi State, 2023, week 05, Opponent: Alabama
| 1 |
3 |
0 |
3 |
0.0 |
Neither |
| 2 |
3 |
1 |
2 |
0.333333 |
Neither |
| 3 |
3 |
0 |
3 |
0.0 |
Turnover |
| 4 |
11 |
5 |
6 |
0.454545 |
Neither |
| 5 |
9 |
4 |
5 |
0.444444 |
Score |
| 6 |
1 |
0 |
1 |
0.0 |
Turnover |
| 7 |
1 |
0 |
1 |
0.0 |
Neither |
| 8 |
11 |
6 |
5 |
0.545455 |
Score |
| 9 |
3 |
0 |
3 |
0.0 |
Neither |
| 10 |
6 |
2 |
4 |
0.333333 |
Neither |
| 11 |
4 |
0 |
4 |
0.0 |
Turnover |
| 12 |
7 |
3 |
4 |
0.428571 |
Neither |
Mean drive SR by week: Mississippi State, 2023, week 05, Opponent: Alabama
| wk01 |
0.470661 |
| wk02 |
0.353175 |
| wk03 |
0.175 |
| wk04 |
0.421296 |
| wk05 |
0.21164 |
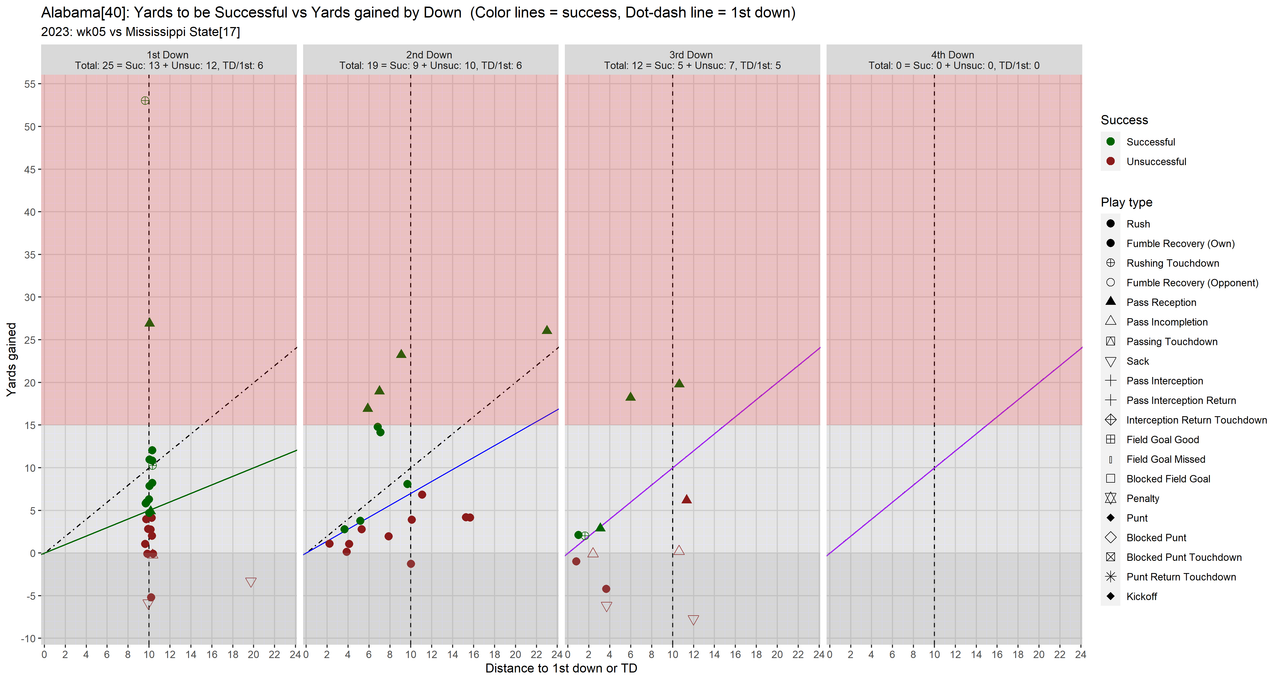
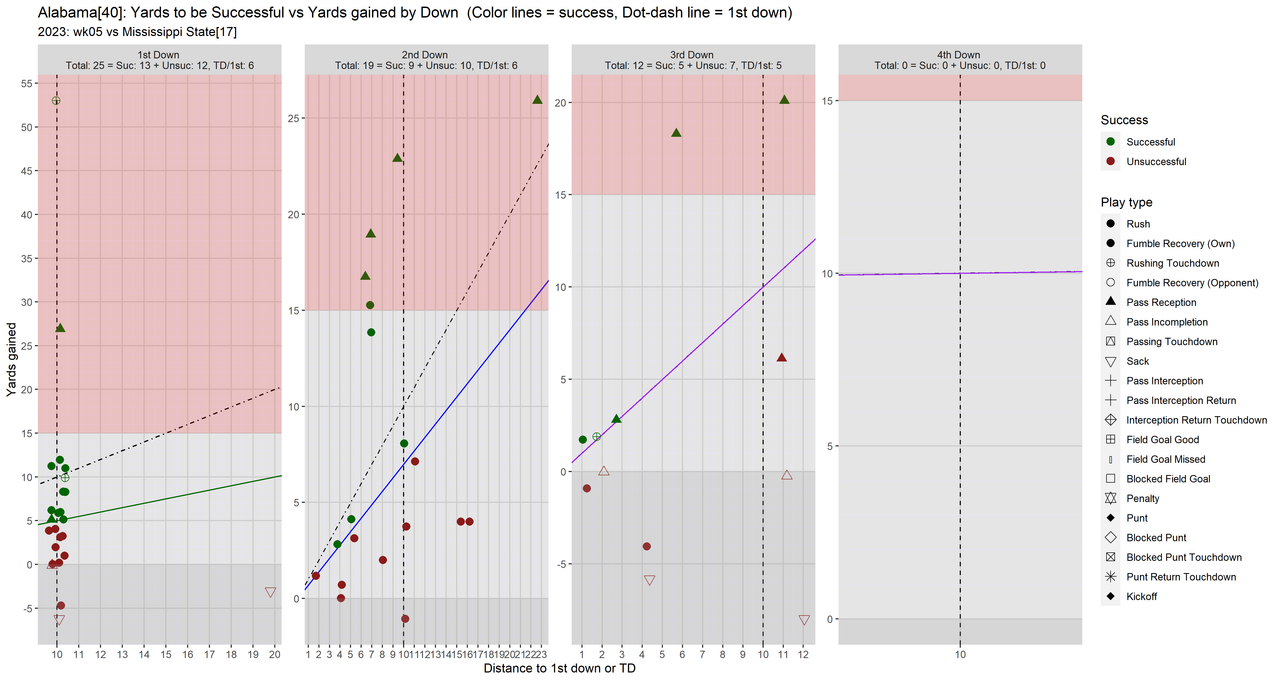
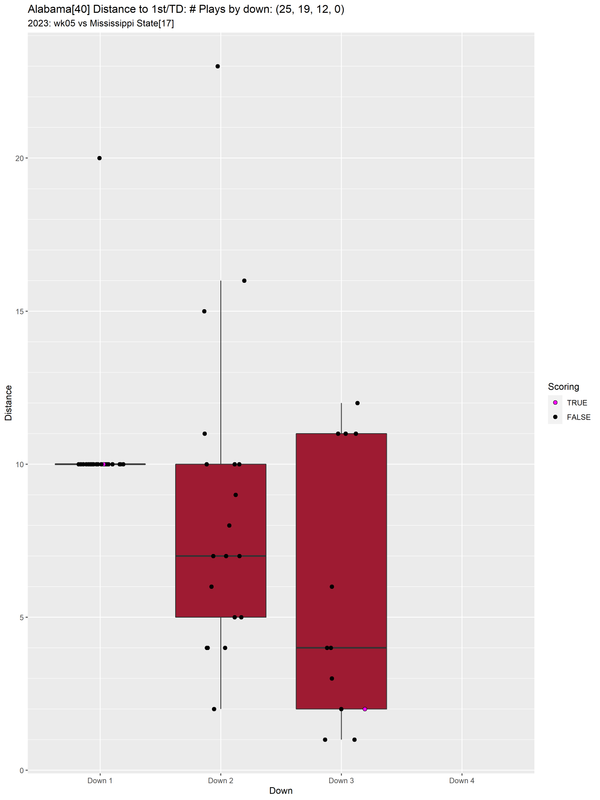
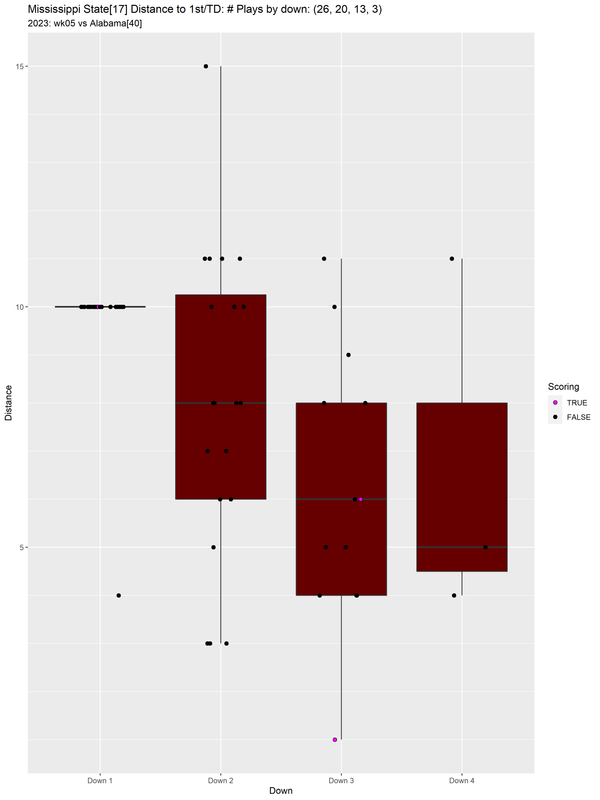
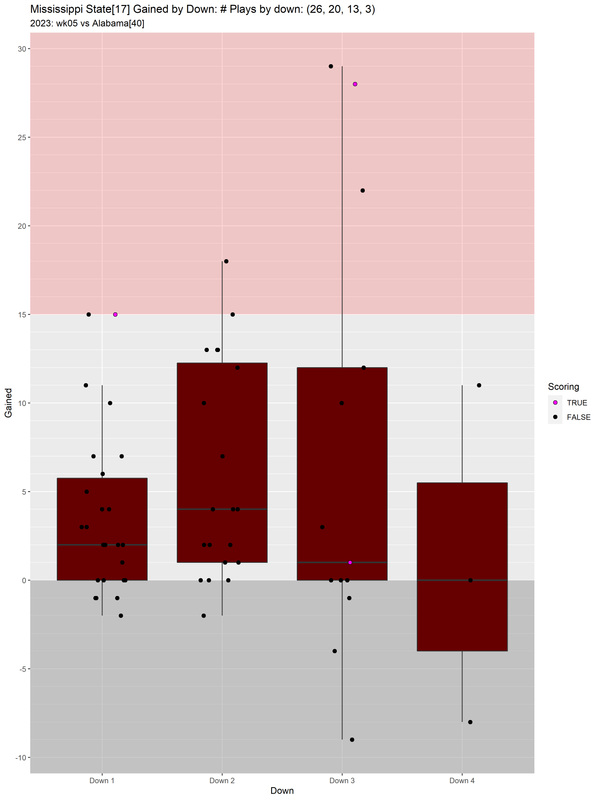
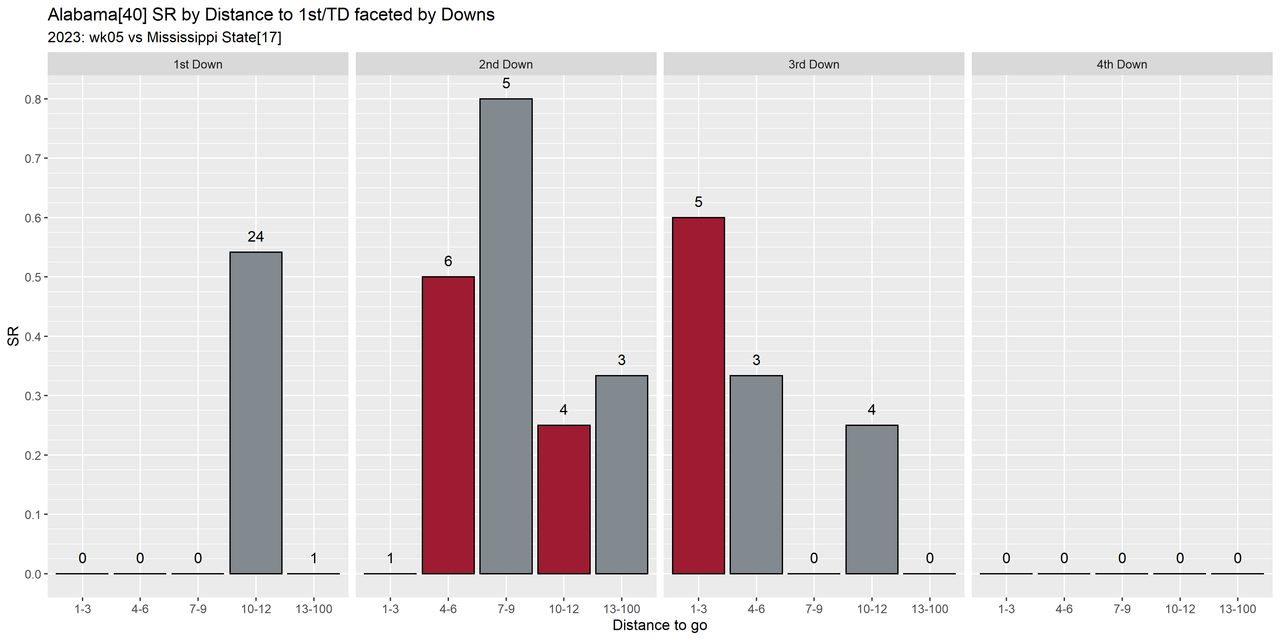
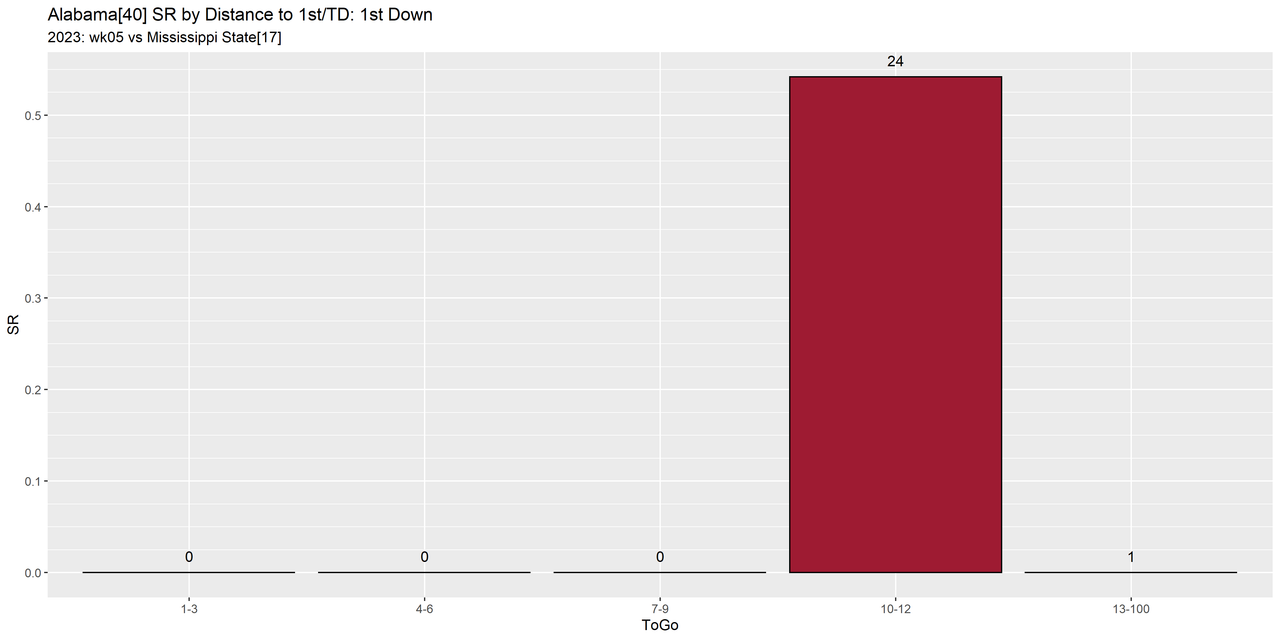
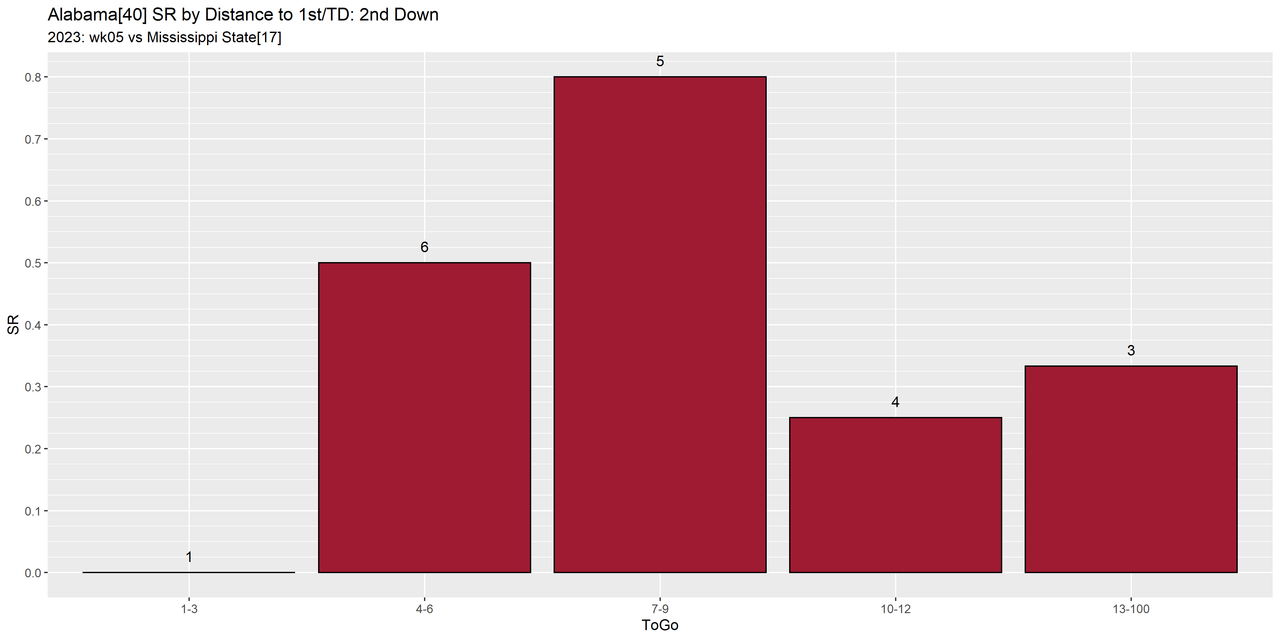
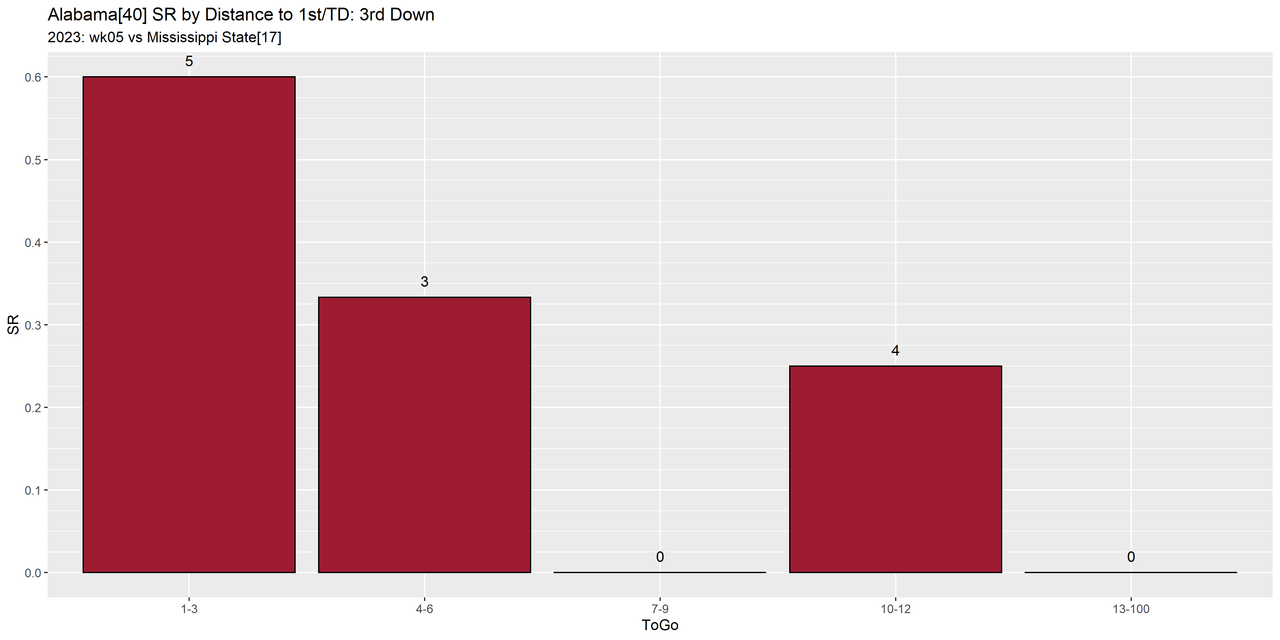
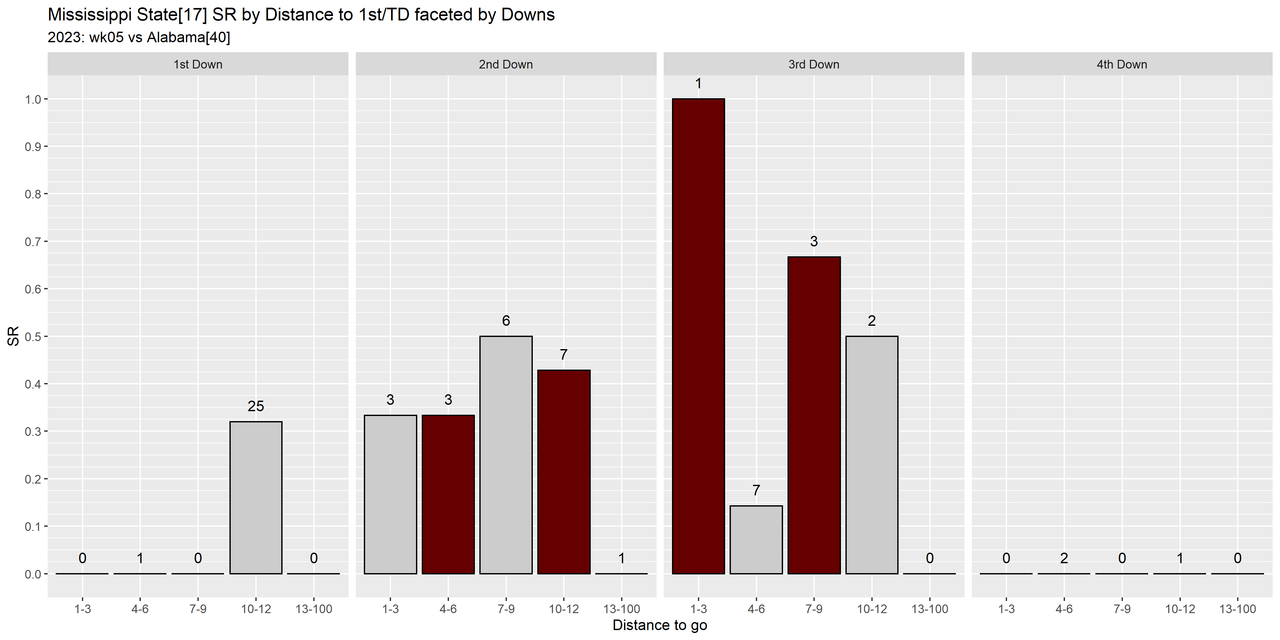
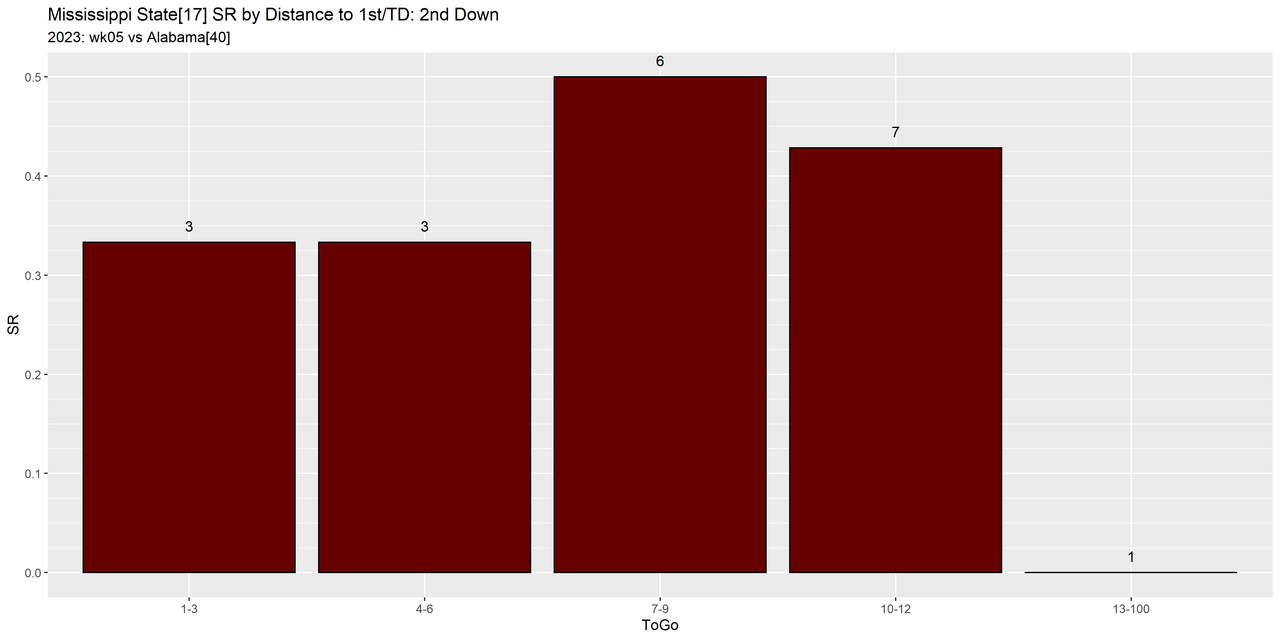
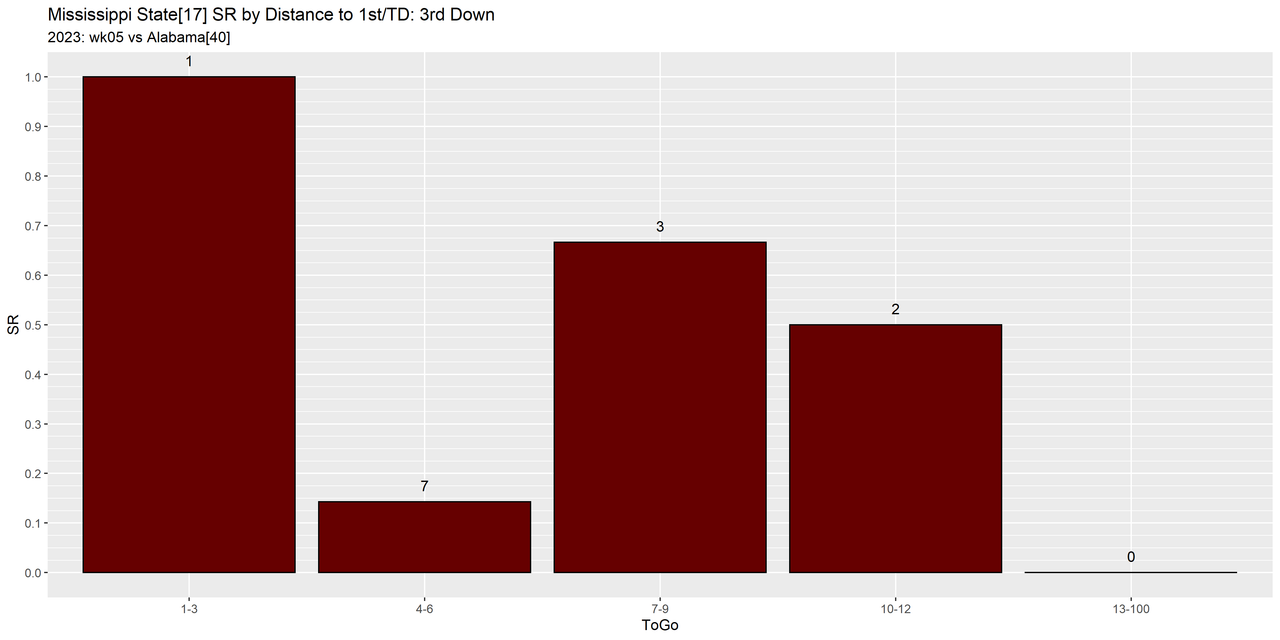
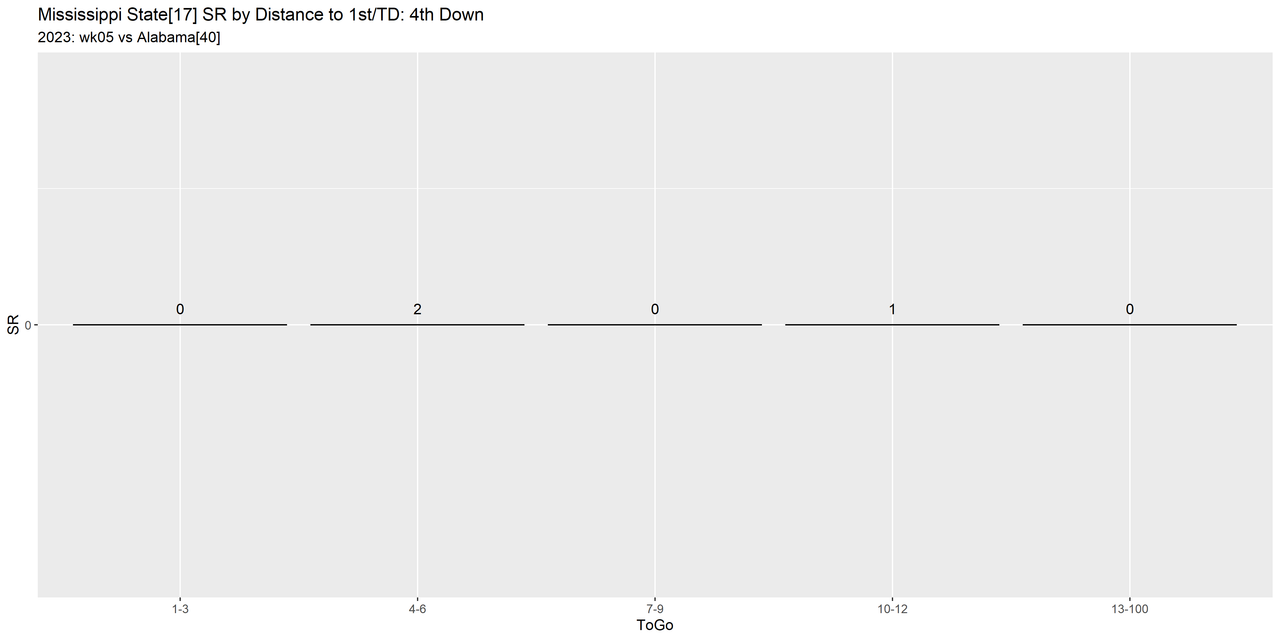
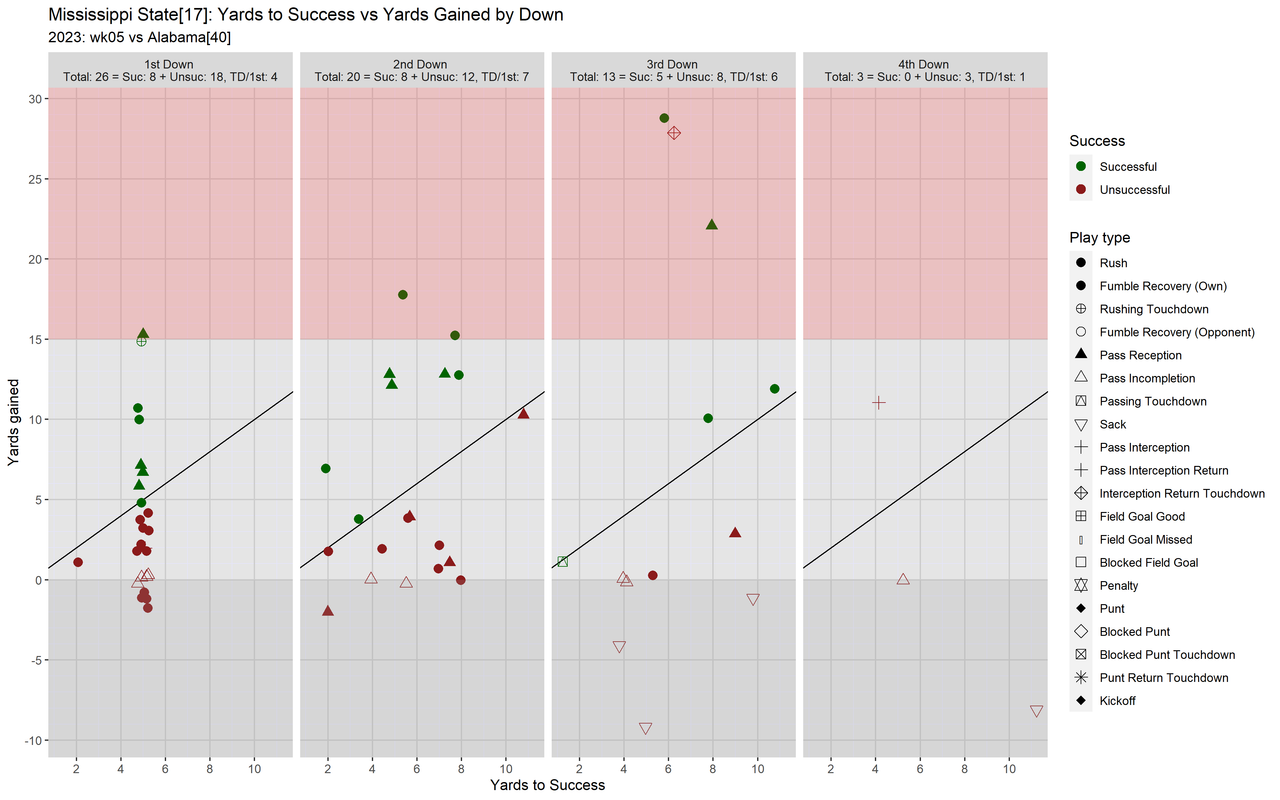
I'm still not totally sure what to make of the table below.
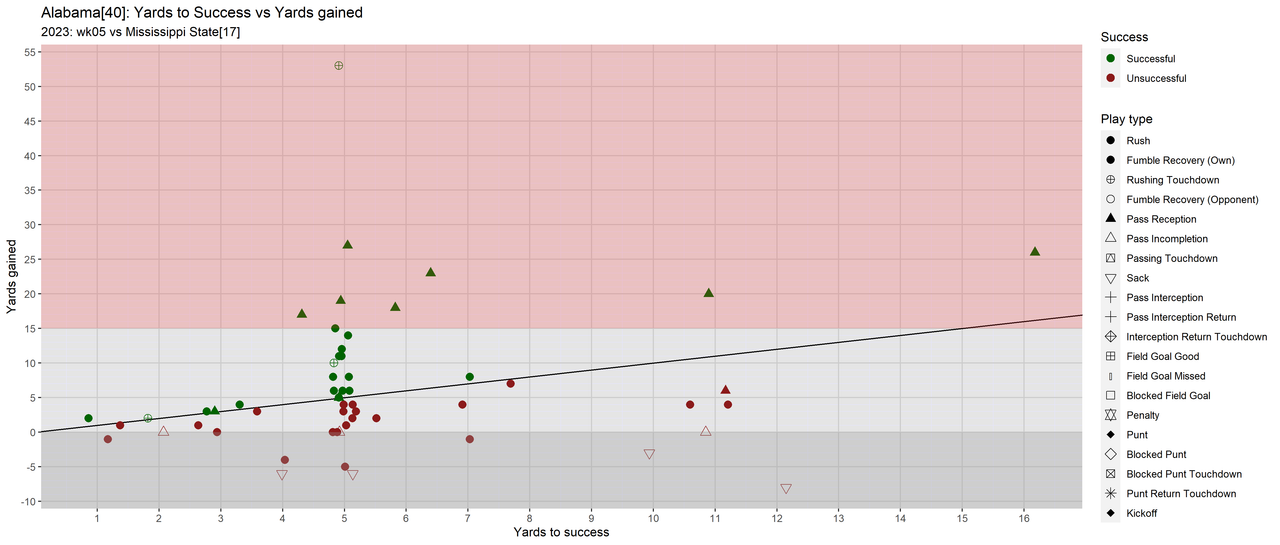
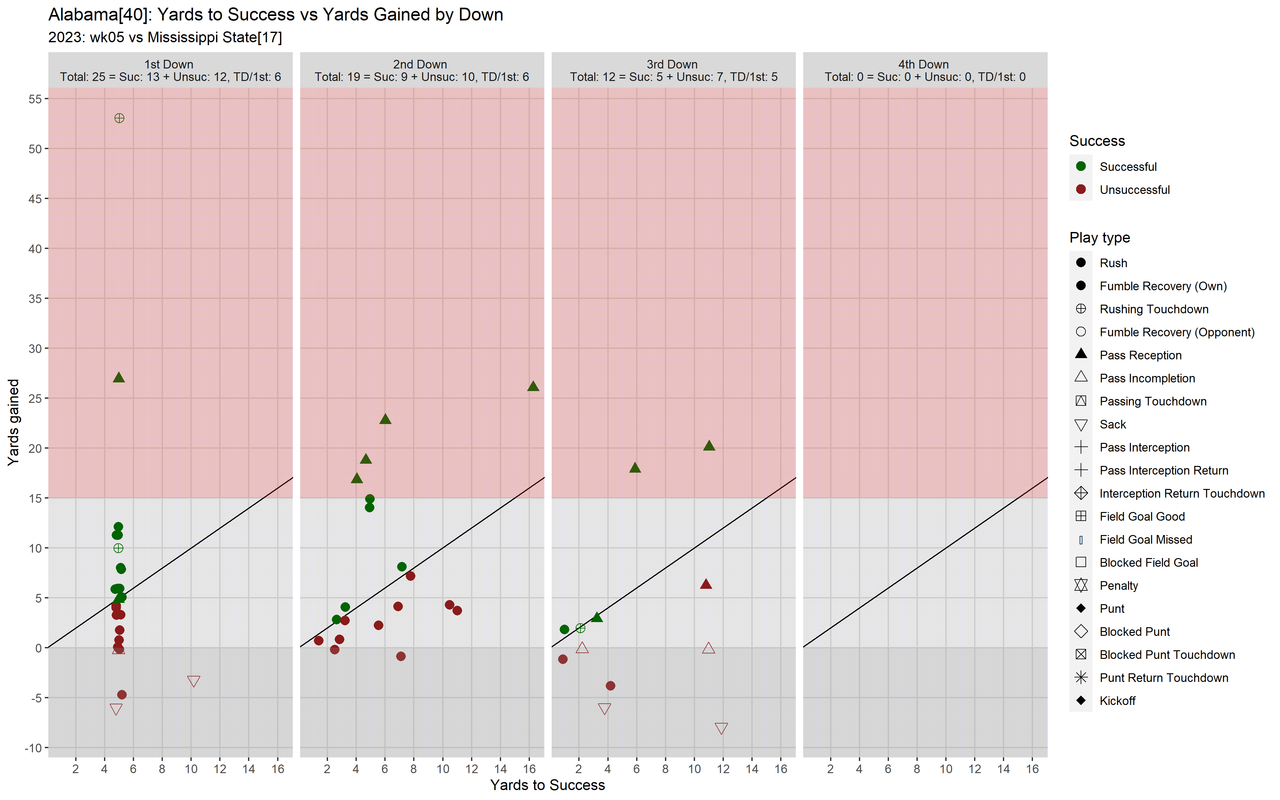
It feels like having a mean distance to 1st/TD on second and third downs of 8.6 and 5.7 respectively is not good.
So I am currently running my code on older seasons to see what history has to say about these numbers.
I was going to start at 2020 and work my way back,
but the 2020 data is breaking my code.
So I'll start with 2019 and work backwards until I think I can get a feel for what is going on...
or decide that these numbers are not indicative of performance.
I'll include Clanga's for comparison.
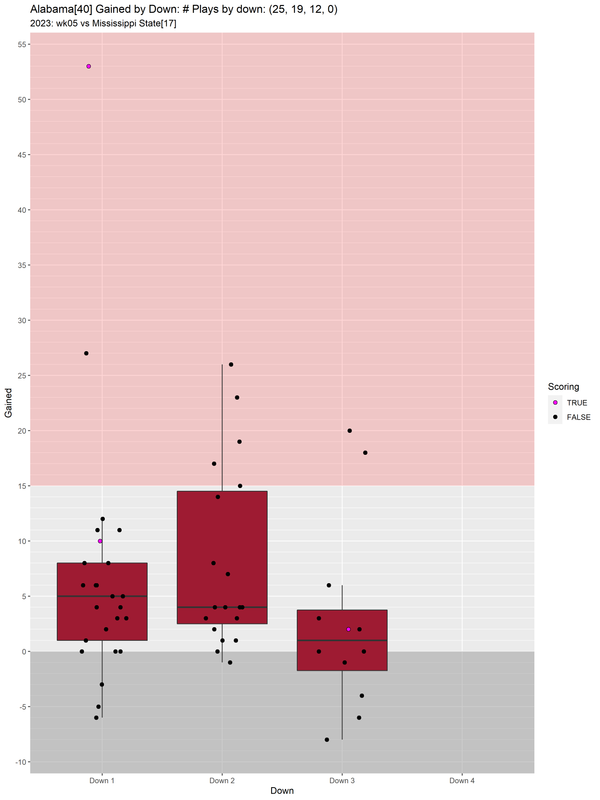
Distance to 1st/TD, Yards gained statistics by down: Alabama, 2023, week 05, Opponent: Mississippi State
| 1 |
25 |
0 |
10.4 |
2.0 |
10.0 |
6.84 |
11.6643 |
5.0 |
| 2 |
19 |
6 |
8.57895 |
5.06969 |
7.0 |
8.10526 |
8.26569 |
4.0 |
| 3 |
12 |
7 |
5.66667 |
4.35542 |
4.0 |
2.66667 |
8.5741 |
1.0 |
| 4 |
0 |
12 |
NaN |
NaN |
NaN |
NaN |
NaN |
NaN |
Distance to 1st/TD, Yards gained statistics by down: Mississippi State, 2023, week 05, Opponent: Alabama
| 1 |
26 |
0 |
9.76923 |
1.1767 |
10.0 |
3.69231 |
4.70548 |
2.0 |
| 2 |
20 |
6 |
8.05 |
3.17017 |
8.0 |
5.95 |
6.09983 |
4.0 |
| 3 |
13 |
7 |
6.23077 |
2.83296 |
6.0 |
7.0 |
12.3288 |
1.0 |
| 4 |
3 |
10 |
6.66667 |
3.78594 |
5.0 |
1.0 |
9.53939 |
0.0 |
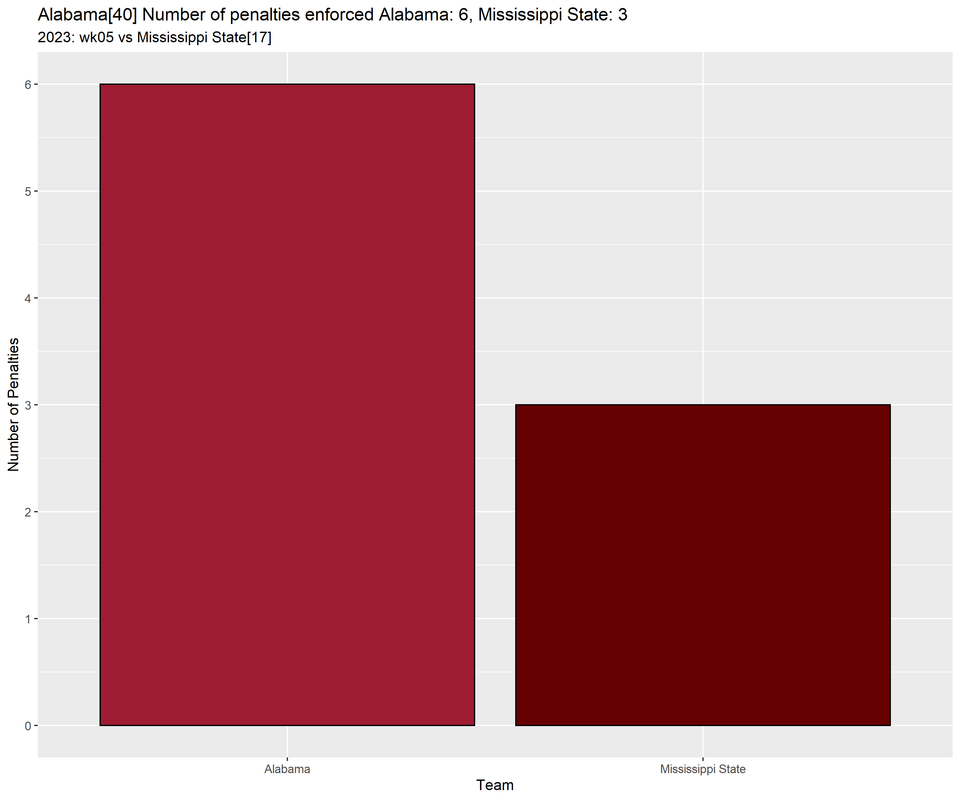
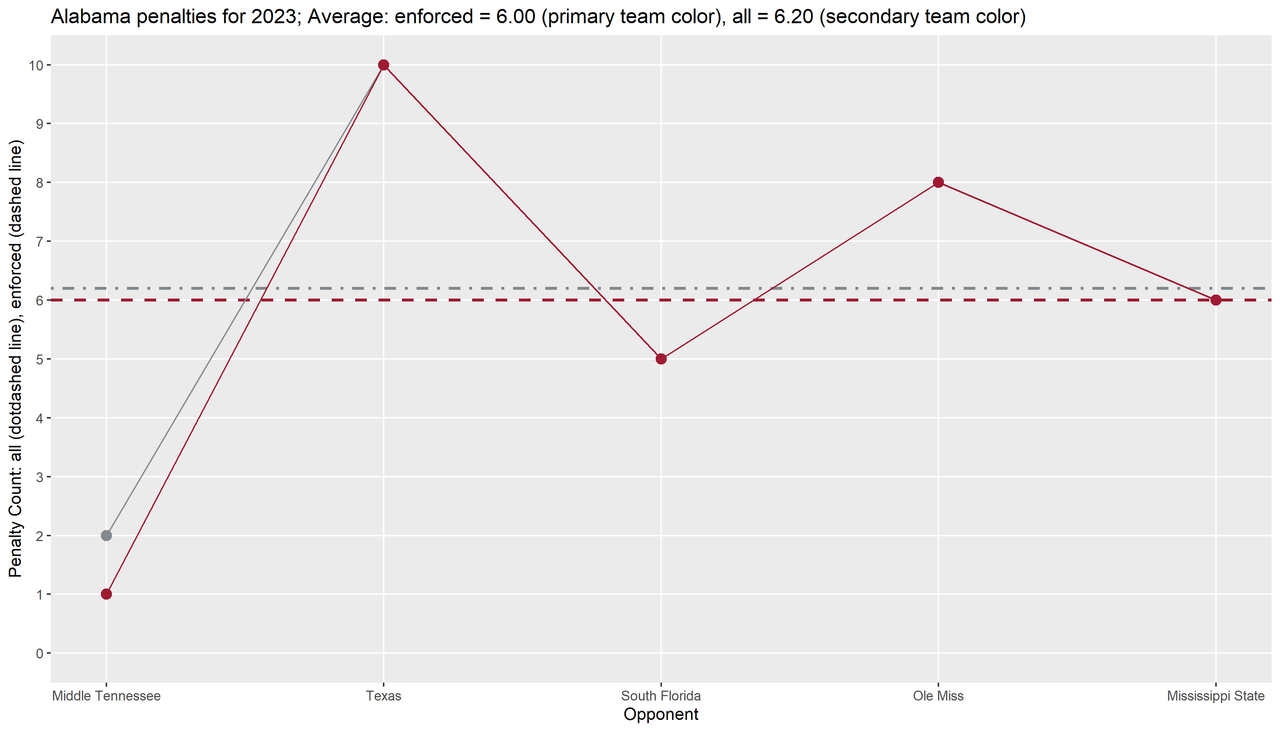
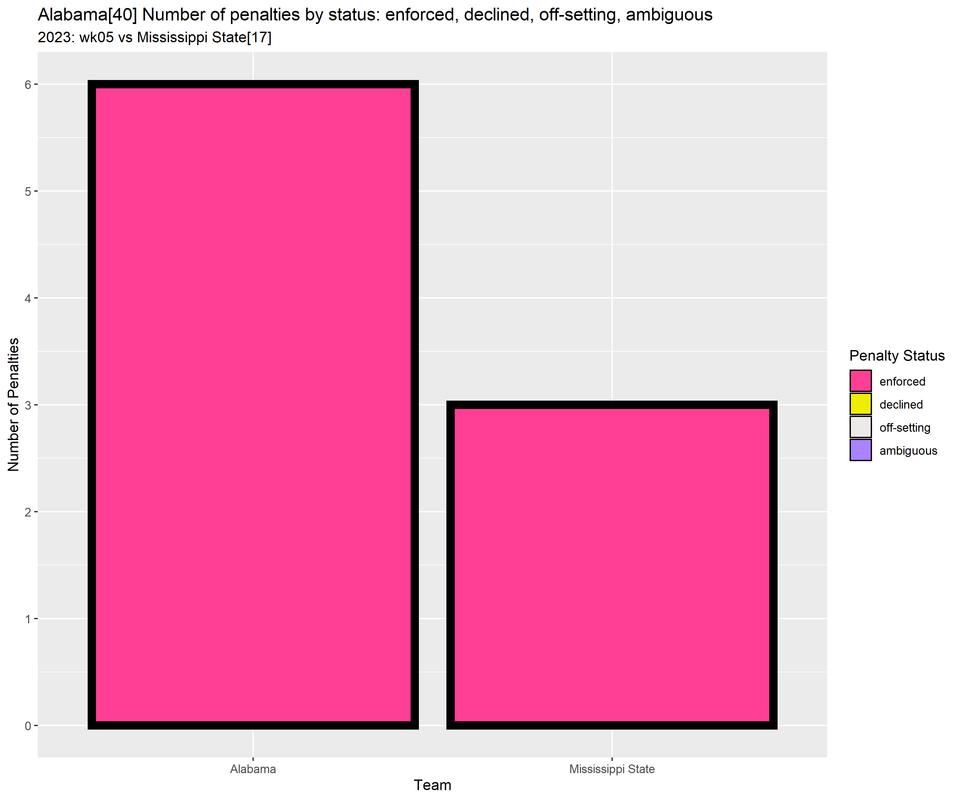
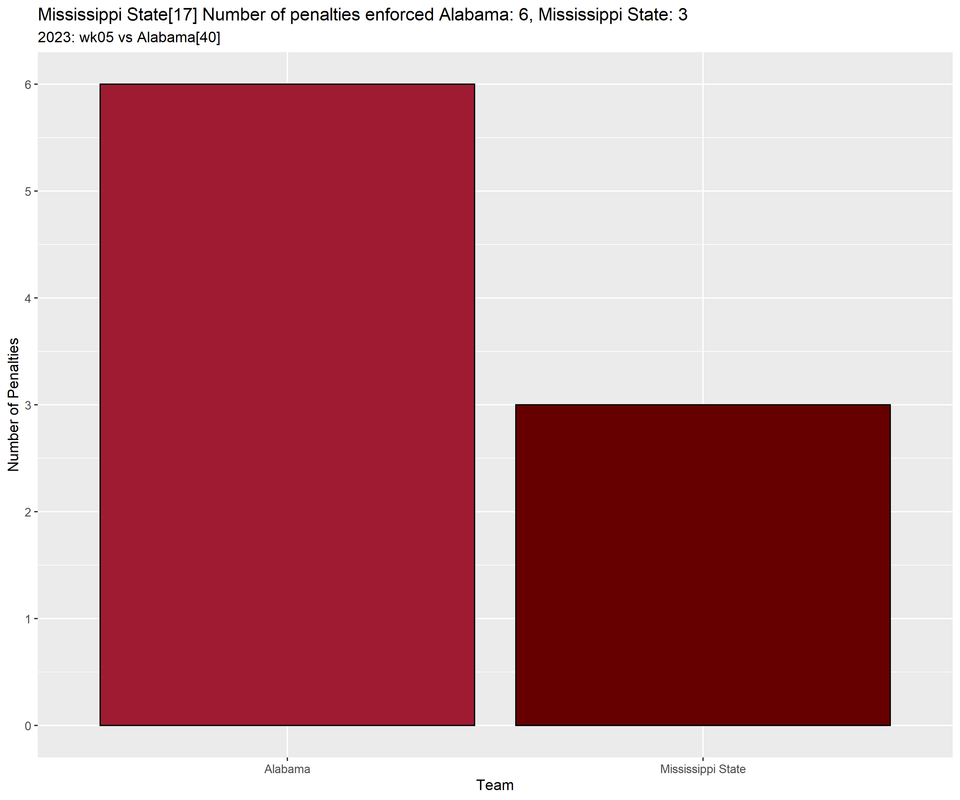
What about penalties?
We are averaging 6 penalties per game
and hit our average this game.
Which is better than the 8 we got at home last game!
A couple of false starts,
especially early on,
is not surprising with their artificial noise-makers!
The Ineligible Downfield On Pass was either on the QB
or the receiver since it was clearly designed to be thrown behind the line of scrimmage if it was thrown.
The last False Start was close to our tackle moving from the defense being in the neutral zone,
but I couldn't tell if he was in the neutral zone or not.
So that was 6 penalties all technically on the offensive line.
Penalties: 2023, week 05
| Alabama |
False Start |
enforced |
| Alabama |
False Start |
enforced |
| Alabama |
Ineligible Downfield On Pass |
enforced |
| Alabama |
Offensive Holding |
enforced |
| Alabama |
Holding |
enforced |
| Alabama |
False Start |
enforced |
| Mississippi State |
False Start |
enforced |
| Mississippi State |
Defensive Offside |
enforced |
| Mississippi State |
Illegal Formation |
enforced |
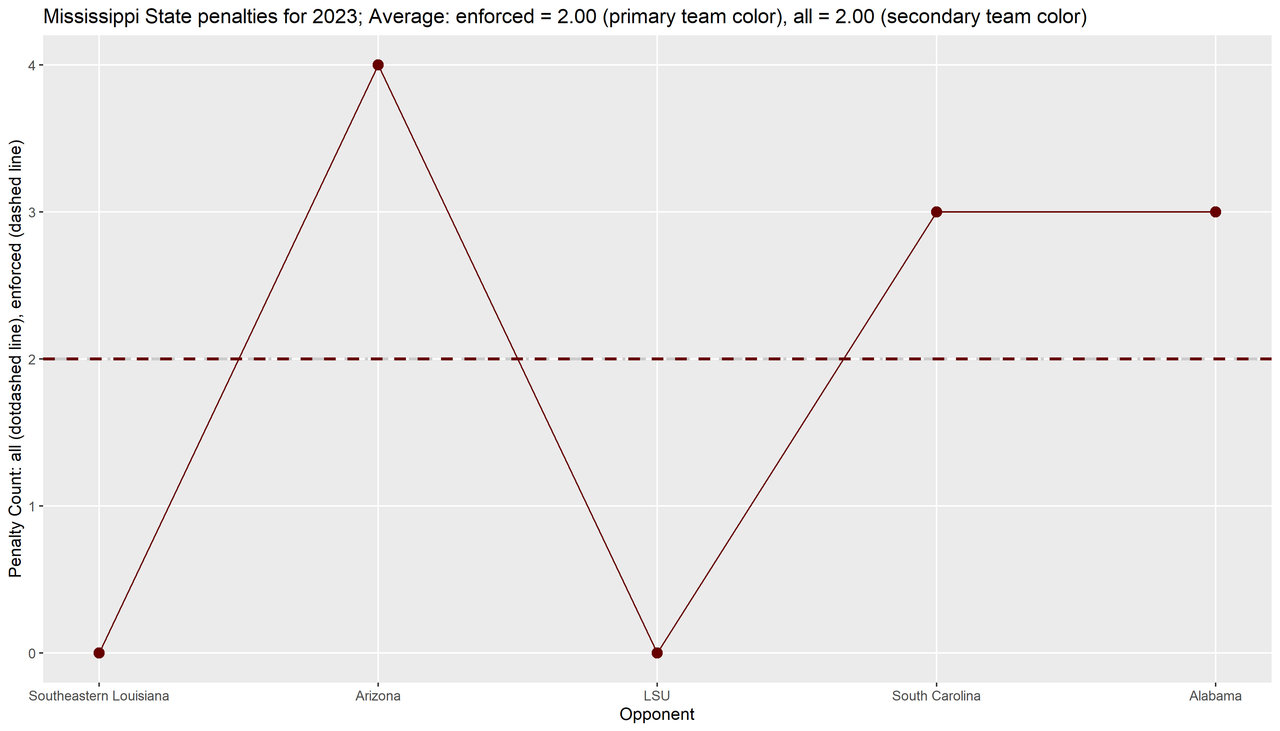
While less is better and zero is best we aren't looking bad in comparison to the SEC or FBS in general.
In the SEC we have a z-score of -0.25 and vs the FBS a z-score of -0.16.
I.e. we are just below average in comparison to the other teams.
SEC
| 0 |
missing |
missing |
missing |
missing |
missing |
missing |
missing |
missing |
missing |
missing |
missing |
missing |
missing |
8 |
| 1 |
2 |
7 |
4 |
9 |
5 |
7 |
2 |
1 |
7 |
7 |
6 |
4 |
9 |
missing |
| 2 |
10 |
4 |
7 |
4 |
3 |
10 |
2 |
9 |
5 |
5 |
8 |
10 |
7 |
5 |
| 3 |
5 |
14 |
5 |
5 |
6 |
5 |
6 |
4 |
6 |
5 |
11 |
10 |
8 |
2 |
| 4 |
6 |
11 |
10 |
5 |
5 |
10 |
5 |
5 |
7 |
8 |
4 |
5 |
7 |
7 |
| 5 |
6 |
0 |
1 |
10 |
3 |
3 |
6 |
3 |
9 |
11 |
5 |
7 |
6 |
4 |
| Texas A&M |
37 |
7.40 |
1.03 |
| Arkansas |
36 |
7.20 |
0.87 |
| Ole Miss |
36 |
7.20 |
0.87 |
| Tennessee |
36 |
7.20 |
0.87 |
| Kentucky |
35 |
7.00 |
0.71 |
| Missouri |
34 |
6.80 |
0.55 |
| South Carolina |
34 |
6.80 |
0.55 |
| Florida |
33 |
6.60 |
0.39 |
| Alabama |
29 |
5.80 |
-0.25 |
| Auburn |
27 |
5.40 |
-0.57 |
| Vanderbilt |
26 |
5.20 |
-0.73 |
| Georgia |
22 |
4.40 |
-1.38 |
| Mississippi State |
22 |
4.40 |
-1.38 |
| LSU |
21 |
4.20 |
-1.54 |
Roll Tide until next week.

Success by drive: Alabama, 2023, week 05, Opponent: Mississippi State
| 1 |
4 |
1 |
3 |
0.25 |
Neither |
| 2 |
3 |
0 |
3 |
0.0 |
Neither |
| 3 |
3 |
2 |
1 |
0.666667 |
Score |
| 4 |
5 |
3 |
2 |
0.6 |
Neither |
| 5 |
12 |
10 |
2 |
0.833333 |
Score |
| 6 |
3 |
2 |
1 |
0.666667 |
Score |
| 7 |
11 |
6 |
5 |
0.545455 |
Neither |
| 8 |
3 |
1 |
2 |
0.333333 |
Neither |
| 9 |
5 |
1 |
4 |
0.2 |
Neither |
| 10 |
3 |
0 |
3 |
0.0 |
Neither |
| 11 |
4 |
1 |
3 |
0.25 |
Neither |
Mean drive SR by week: Alabama, 2023, week 05, Opponent: Mississippi State
| wk01 |
0.544988 |
| wk02 |
0.28649 |
| wk03 |
0.336427 |
| wk04 |
0.362338 |
| wk05 |
0.395041 |
Success by down: Alabama, 2023, week 05, Opponent: Mississippi State
| 1 |
13 |
12 |
25 |
6 |
| 2 |
9 |
10 |
19 |
6 |
| 3 |
5 |
7 |
12 |
5 |
| 4 |
0 |
0 |
0 |
0 |
3rd down Successful/Unsuccessful: Alabama, 2023, week 05, Opponent: Mississippi State
| 1 |
22 |
Successful |
| 1 |
29 |
Unsuccessful |
| 2 |
2 |
Successful |
| 2 |
72 |
Unsuccessful |
| 3 |
68 |
Successful |
| 4 |
14 |
Unsuccessful |
| 4 |
45 |
Unsuccessful |
| 6 |
61 |
Successful |
| 11 |
22 |
Unsuccessful |
| 11 |
35 |
Unsuccessful |
| 11 |
51 |
Successful |
| 12 |
60 |
Unsuccessful |
Distance to 1st/TD, Yards gained statistics by down: Alabama, 2023, week 05, Opponent: Mississippi State
| 1 |
25 |
0 |
10.4 |
2.0 |
10.0 |
6.84 |
11.6643 |
5.0 |
| 2 |
19 |
6 |
8.57895 |
5.06969 |
7.0 |
8.10526 |
8.26569 |
4.0 |
| 3 |
12 |
7 |
5.66667 |
4.35542 |
4.0 |
2.66667 |
8.5741 |
1.0 |
| 4 |
0 |
12 |
NaN |
NaN |
NaN |
NaN |
NaN |
NaN |
Penalties: 2023, week 05
| Alabama |
False Start |
enforced |
| Alabama |
False Start |
enforced |
| Alabama |
Ineligible Downfield On Pass |
enforced |
| Alabama |
Offensive Holding |
enforced |
| Alabama |
Holding |
enforced |
| Alabama |
False Start |
enforced |
| Mississippi State |
False Start |
enforced |
| Mississippi State |
Defensive Offside |
enforced |
| Mississippi State |
Illegal Formation |
enforced |

Success by drive: Mississippi State, 2023, week 05, Opponent: Alabama
| 1 |
3 |
0 |
3 |
0.0 |
Neither |
| 2 |
3 |
1 |
2 |
0.333333 |
Neither |
| 3 |
3 |
0 |
3 |
0.0 |
Turnover |
| 4 |
11 |
5 |
6 |
0.454545 |
Neither |
| 5 |
9 |
4 |
5 |
0.444444 |
Score |
| 6 |
1 |
0 |
1 |
0.0 |
Turnover |
| 7 |
1 |
0 |
1 |
0.0 |
Neither |
| 8 |
11 |
6 |
5 |
0.545455 |
Score |
| 9 |
3 |
0 |
3 |
0.0 |
Neither |
| 10 |
6 |
2 |
4 |
0.333333 |
Neither |
| 11 |
4 |
0 |
4 |
0.0 |
Turnover |
| 12 |
7 |
3 |
4 |
0.428571 |
Neither |
Mean drive SR by week: Mississippi State, 2023, week 05, Opponent: Alabama
| wk01 |
0.470661 |
| wk02 |
0.353175 |
| wk03 |
0.175 |
| wk04 |
0.421296 |
| wk05 |
0.21164 |
Success by down: Mississippi State, 2023, week 05, Opponent: Alabama
| 1 |
8 |
18 |
26 |
4 |
| 2 |
8 |
12 |
20 |
7 |
| 3 |
5 |
8 |
13 |
6 |
| 4 |
0 |
3 |
3 |
1 |
3rd down Successful/Unsuccessful: Mississippi State, 2023, week 05, Opponent: Alabama
| 1 |
1 |
Successful |
| 4 |
9 |
Unsuccessful |
| 4 |
69 |
Unsuccessful |
| 4 |
76 |
Unsuccessful |
| 5 |
28 |
Unsuccessful |
| 5 |
75 |
Unsuccessful |
| 6 |
44 |
Successful |
| 6 |
71 |
Unsuccessful |
| 8 |
38 |
Successful |
| 8 |
62 |
Successful |
| 9 |
98 |
Unsuccessful |
| 10 |
57 |
Unsuccessful |
| 11 |
76 |
Successful |
Distance to 1st/TD, Yards gained statistics by down: Mississippi State, 2023, week 05, Opponent: Alabama
| 1 |
26 |
0 |
9.76923 |
1.1767 |
10.0 |
3.69231 |
4.70548 |
2.0 |
| 2 |
20 |
6 |
8.05 |
3.17017 |
8.0 |
5.95 |
6.09983 |
4.0 |
| 3 |
13 |
7 |
6.23077 |
2.83296 |
6.0 |
7.0 |
12.3288 |
1.0 |
| 4 |
3 |
10 |
6.66667 |
3.78594 |
5.0 |
1.0 |
9.53939 |
0.0 |


Penalties: 2023, week 05
| Alabama |
False Start |
enforced |
| Alabama |
False Start |
enforced |
| Alabama |
Ineligible Downfield On Pass |
enforced |
| Alabama |
Offensive Holding |
enforced |
| Alabama |
Holding |
enforced |
| Alabama |
False Start |
enforced |
| Mississippi State |
False Start |
enforced |
| Mississippi State |
Defensive Offside |
enforced |
| Mississippi State |
Illegal Formation |
enforced |
All SEC teams
All data below includes intra-conference games and OOC games.
Summary statistics for FBS conferences
| FBS |
6.00 |
2.81 |
0 |
4.0 |
6.0 |
8.0 |
18 |
| ACC |
6.36 |
3.21 |
0 |
4.0 |
7.0 |
8.0 |
18 |
| American Athletic |
5.65 |
2.73 |
1 |
4.0 |
5.0 |
7.0 |
14 |
| Big 12 |
5.56 |
2.36 |
1 |
4.0 |
5.0 |
7.0 |
11 |
| Big Ten |
5.06 |
2.72 |
0 |
4.0 |
5.0 |
7.0 |
11 |
| Conference USA |
6.75 |
2.61 |
2 |
5.0 |
6.5 |
8.0 |
12 |
| FBS Independents |
6.24 |
3.30 |
0 |
4.0 |
7.0 |
9.0 |
12 |
| Mid-American |
6.02 |
2.72 |
1 |
4.0 |
6.0 |
8.0 |
12 |
| Mountain West |
5.96 |
3.37 |
1 |
3.0 |
5.0 |
8.0 |
17 |
| Pac-12 |
6.57 |
2.88 |
2 |
5.0 |
6.0 |
8.75 |
14 |
| SEC |
6.11 |
2.78 |
0 |
4.25 |
6.0 |
8.0 |
14 |
| Sun Belt |
5.99 |
2.64 |
2 |
4.0 |
5.0 |
7.25 |
14 |
ACC
| 0 |
missing |
missing |
missing |
missing |
missing |
missing |
missing |
missing |
missing |
missing |
missing |
missing |
missing |
missing |
| 1 |
10 |
1 |
7 |
7 |
2 |
7 |
8 |
1 |
7 |
7 |
7 |
2 |
4 |
4 |
| 2 |
10 |
4 |
4 |
3 |
3 |
7 |
10 |
8 |
5 |
5 |
9 |
8 |
3 |
3 |
| 3 |
18 |
5 |
1 |
5 |
0 |
6 |
5 |
6 |
5 |
9 |
9 |
7 |
7 |
6 |
| 4 |
7 |
6 |
8 |
7 |
14 |
4 |
7 |
7 |
3 |
11 |
6 |
7 |
9 |
2 |
| 5 |
5 |
6 |
2 |
missing |
6 |
10 |
missing |
10 |
missing |
8 |
9 |
11 |
10 |
missing |
| Pittsburgh |
40 |
8.00 |
1.14 |
| Syracuse |
40 |
8.00 |
1.14 |
| Miami |
30 |
7.50 |
0.71 |
| Virginia |
35 |
7.00 |
0.44 |
| Louisville |
34 |
6.80 |
0.30 |
| Virginia Tech |
33 |
6.60 |
0.16 |
| NC State |
32 |
6.40 |
0.03 |
| Florida State |
22 |
5.50 |
-0.54 |
| Georgia Tech |
25 |
5.00 |
-0.95 |
| North Carolina |
20 |
5.00 |
-0.85 |
| Clemson |
22 |
4.40 |
-1.37 |
| Duke |
22 |
4.40 |
-1.37 |
| Wake Forest |
15 |
3.75 |
-1.63 |
| Boston College |
50 |
10.00 |
2.53 |
American Athletic
| 0 |
missing |
missing |
missing |
missing |
missing |
missing |
missing |
missing |
missing |
missing |
missing |
missing |
missing |
missing |
| 1 |
6 |
10 |
3 |
5 |
3 |
2 |
5 |
6 |
11 |
3 |
7 |
4 |
5 |
8 |
| 2 |
6 |
11 |
5 |
3 |
4 |
3 |
4 |
2 |
14 |
7 |
2 |
7 |
4 |
1 |
| 3 |
7 |
11 |
6 |
3 |
2 |
9 |
6 |
7 |
5 |
9 |
4 |
7 |
9 |
5 |
| 4 |
7 |
5 |
6 |
5 |
missing |
missing |
6 |
4 |
9 |
6 |
9 |
3 |
4 |
5 |
| 5 |
7 |
6 |
missing |
5 |
8 |
6 |
10 |
8 |
1 |
2 |
5 |
2 |
3 |
missing |
| East Carolina |
43 |
8.60 |
2.41 |
| South Florida |
40 |
8.00 |
1.92 |
| Charlotte |
33 |
6.60 |
0.78 |
| Rice |
31 |
6.20 |
0.45 |
| SMU |
27 |
5.40 |
-0.21 |
| Temple |
27 |
5.40 |
-0.21 |
| Tulane |
27 |
5.40 |
-0.21 |
| Florida Atlantic |
20 |
5.00 |
-0.48 |
| North Texas |
20 |
5.00 |
-0.48 |
| UAB |
25 |
5.00 |
-0.53 |
| UT San Antonio |
19 |
4.75 |
-0.66 |
| Tulsa |
23 |
4.60 |
-0.86 |
| Navy |
17 |
4.25 |
-1.03 |
| Memphis |
21 |
4.20 |
-1.19 |
Big 12
| 0 |
missing |
missing |
missing |
missing |
missing |
missing |
missing |
missing |
missing |
missing |
missing |
missing |
missing |
missing |
| 1 |
9 |
8 |
7 |
3 |
9 |
3 |
4 |
6 |
5 |
10 |
5 |
7 |
7 |
5 |
| 2 |
5 |
3 |
7 |
6 |
2 |
4 |
5 |
9 |
9 |
5 |
4 |
6 |
4 |
4 |
| 3 |
2 |
7 |
10 |
7 |
5 |
7 |
7 |
7 |
7 |
7 |
6 |
2 |
7 |
4 |
| 4 |
4 |
3 |
2 |
11 |
5 |
7 |
5 |
8 |
3 |
6 |
2 |
9 |
10 |
3 |
| 5 |
4 |
4 |
7 |
4 |
6 |
3 |
missing |
5 |
missing |
7 |
4 |
1 |
7 |
2 |
| Oklahoma |
35 |
7.00 |
1.36 |
| TCU |
35 |
7.00 |
1.36 |
| UCF |
35 |
7.00 |
1.36 |
| Cincinnati |
33 |
6.60 |
0.98 |
| Houston |
31 |
6.20 |
0.61 |
| Oklahoma State |
24 |
6.00 |
0.37 |
| Iowa State |
27 |
5.40 |
-0.15 |
| Kansas State |
21 |
5.25 |
-0.26 |
| BYU |
25 |
5.00 |
-0.53 |
| Texas Tech |
25 |
5.00 |
-0.53 |
| Baylor |
24 |
4.80 |
-0.72 |
| Kansas |
24 |
4.80 |
-0.72 |
| Texas |
21 |
4.20 |
-1.29 |
| West Virginia |
18 |
3.60 |
-1.85 |
Big Ten
| 0 |
missing |
missing |
missing |
missing |
missing |
missing |
missing |
missing |
missing |
missing |
missing |
missing |
missing |
missing |
| 1 |
10 |
8 |
7 |
6 |
5 |
8 |
3 |
7 |
3 |
5 |
1 |
4 |
2 |
3 |
| 2 |
6 |
7 |
0 |
4 |
4 |
5 |
2 |
6 |
4 |
6 |
7 |
7 |
5 |
4 |
| 3 |
6 |
4 |
1 |
7 |
1 |
11 |
3 |
5 |
1 |
5 |
7 |
11 |
4 |
8 |
| 4 |
6 |
5 |
4 |
4 |
3 |
6 |
5 |
6 |
8 |
5 |
4 |
7 |
5 |
11 |
| 5 |
9 |
4 |
3 |
4 |
0 |
10 |
1 |
4 |
4 |
missing |
6 |
3 |
4 |
missing |
| Michigan State |
40 |
8.00 |
2.42 |
| Illinois |
37 |
7.40 |
1.93 |
| Wisconsin |
26 |
6.50 |
1.06 |
| Purdue |
32 |
6.40 |
1.10 |
| Indiana |
28 |
5.60 |
0.45 |
| Nebraska |
28 |
5.60 |
0.45 |
| Ohio State |
21 |
5.25 |
0.14 |
| Maryland |
25 |
5.00 |
-0.05 |
| Penn State |
25 |
5.00 |
-0.05 |
| Northwestern |
20 |
4.00 |
-0.87 |
| Rutgers |
20 |
4.00 |
-0.87 |
| Iowa |
15 |
3.00 |
-1.69 |
| Minnesota |
14 |
2.80 |
-1.86 |
| Michigan |
13 |
2.60 |
-2.02 |
Conference USA
| 0 |
5 |
7 |
missing |
5 |
missing |
6 |
missing |
10 |
missing |
| 1 |
missing |
missing |
4 |
missing |
9 |
missing |
7 |
missing |
9 |
| 2 |
6 |
7 |
7 |
8 |
6 |
6 |
2 |
6 |
4 |
| 3 |
8 |
missing |
10 |
5 |
12 |
7 |
missing |
6 |
3 |
| 4 |
5 |
4 |
4 |
12 |
6 |
3 |
10 |
8 |
3 |
| 5 |
missing |
6 |
missing |
12 |
7 |
missing |
8 |
9 |
8 |
| Louisiana Tech |
42 |
8.40 |
1.41 |
| Middle Tennessee |
40 |
8.00 |
1.07 |
| UTEP |
39 |
7.80 |
0.90 |
| Sam Houston State |
27 |
6.75 |
0.00 |
| Liberty |
25 |
6.25 |
-0.38 |
| Florida International |
24 |
6.00 |
-0.58 |
| Jacksonville State |
24 |
6.00 |
-0.58 |
| New Mexico State |
22 |
5.50 |
-0.96 |
| Western Kentucky |
27 |
5.40 |
-1.16 |
FBS Independents
| 0 |
missing |
missing |
4 |
8 |
| 1 |
3 |
6 |
1 |
9 |
| 2 |
4 |
8 |
10 |
7 |
| 3 |
0 |
6 |
8 |
7 |
| 4 |
1 |
4 |
4 |
11 |
| 5 |
missing |
9 |
12 |
9 |
| UMass |
51 |
8.50 |
1.68 |
| Connecticut |
33 |
6.60 |
0.25 |
| Notre Dame |
39 |
6.50 |
0.19 |
| Army |
8 |
2.00 |
-2.57 |
Mid-American
| 0 |
missing |
missing |
missing |
missing |
missing |
missing |
missing |
missing |
missing |
3 |
missing |
missing |
| 1 |
10 |
4 |
9 |
6 |
7 |
6 |
4 |
5 |
4 |
missing |
7 |
3 |
| 2 |
8 |
3 |
6 |
8 |
8 |
8 |
5 |
8 |
7 |
1 |
4 |
9 |
| 3 |
6 |
4 |
2 |
6 |
2 |
10 |
7 |
7 |
2 |
1 |
8 |
8 |
| 4 |
10 |
3 |
12 |
6 |
4 |
3 |
11 |
4 |
5 |
8 |
11 |
5 |
| 5 |
2 |
10 |
10 |
5 |
8 |
4 |
5 |
3 |
5 |
missing |
7 |
8 |
| Bowling Green |
39 |
7.80 |
1.46 |
| Toledo |
37 |
7.40 |
1.14 |
| Akron |
36 |
7.20 |
0.97 |
| Western Michigan |
33 |
6.60 |
0.48 |
| Kent State |
32 |
6.40 |
0.31 |
| Buffalo |
31 |
6.20 |
0.15 |
| Eastern Michigan |
31 |
6.20 |
0.15 |
| Central Michigan |
29 |
5.80 |
-0.18 |
| Miami (OH) |
27 |
5.40 |
-0.51 |
| Ball State |
24 |
4.80 |
-1.00 |
| Northern Illinois |
23 |
4.60 |
-1.16 |
| Ohio |
13 |
3.25 |
-2.03 |
Mountain West
| 0 |
missing |
missing |
missing |
missing |
7 |
missing |
missing |
14 |
missing |
missing |
missing |
| 1 |
2 |
3 |
4 |
7 |
missing |
4 |
10 |
missing |
6 |
10 |
3 |
| 2 |
2 |
4 |
missing |
7 |
11 |
3 |
11 |
4 |
3 |
4 |
3 |
| 3 |
6 |
4 |
17 |
9 |
5 |
3 |
7 |
1 |
10 |
4 |
3 |
| 4 |
4 |
4 |
11 |
3 |
4 |
3 |
6 |
5 |
10 |
9 |
8 |
| 5 |
1 |
3 |
7 |
2 |
6 |
10 |
9 |
5 |
8 |
7 |
6 |
| Colorado State |
39 |
9.75 |
2.25 |
| New Mexico |
43 |
8.60 |
1.75 |
| UNLV |
37 |
7.40 |
0.95 |
| Utah State |
34 |
6.80 |
0.56 |
| Hawai'i |
33 |
6.60 |
0.42 |
| San Diego State |
29 |
5.80 |
-0.11 |
| Fresno State |
28 |
5.60 |
-0.24 |
| Nevada |
23 |
4.60 |
-0.91 |
| Wyoming |
23 |
4.60 |
-0.91 |
| Boise State |
18 |
3.60 |
-1.57 |
| Air Force |
15 |
3.00 |
-1.97 |
Pac-12
| 0 |
missing |
missing |
missing |
missing |
missing |
missing |
missing |
missing |
8 |
missing |
missing |
missing |
| 1 |
11 |
9 |
8 |
6 |
2 |
9 |
9 |
8 |
8 |
5 |
5 |
3 |
| 2 |
5 |
4 |
4 |
9 |
14 |
2 |
5 |
7 |
8 |
7 |
7 |
8 |
| 3 |
6 |
2 |
6 |
10 |
9 |
4 |
6 |
3 |
missing |
5 |
11 |
5 |
| 4 |
5 |
4 |
2 |
12 |
9 |
5 |
6 |
6 |
10 |
4 |
9 |
7 |
| 5 |
8 |
5 |
7 |
7 |
2 |
11 |
4 |
missing |
5 |
3 |
12 |
missing |
| Colorado |
44 |
8.80 |
1.73 |
| Washington |
44 |
8.80 |
1.73 |
| USC |
39 |
7.80 |
0.96 |
| Oregon |
36 |
7.20 |
0.49 |
| Arizona |
35 |
7.00 |
0.33 |
| Oregon State |
31 |
6.20 |
-0.29 |
| Stanford |
30 |
6.00 |
-0.44 |
| UCLA |
24 |
6.00 |
-0.40 |
| Washington State |
23 |
5.75 |
-0.57 |
| California |
27 |
5.40 |
-0.91 |
| Arizona State |
24 |
4.80 |
-1.37 |
| Utah |
24 |
4.80 |
-1.37 |
SEC
| 0 |
missing |
missing |
missing |
missing |
missing |
missing |
missing |
missing |
missing |
missing |
missing |
missing |
missing |
8 |
| 1 |
2 |
7 |
4 |
9 |
5 |
7 |
2 |
1 |
7 |
7 |
6 |
4 |
9 |
missing |
| 2 |
10 |
4 |
7 |
4 |
3 |
10 |
2 |
9 |
5 |
5 |
8 |
10 |
7 |
5 |
| 3 |
5 |
14 |
5 |
5 |
6 |
5 |
6 |
4 |
6 |
5 |
11 |
10 |
8 |
2 |
| 4 |
6 |
11 |
10 |
5 |
5 |
10 |
5 |
5 |
7 |
8 |
4 |
5 |
7 |
7 |
| 5 |
6 |
0 |
1 |
10 |
3 |
3 |
6 |
3 |
9 |
11 |
5 |
7 |
6 |
4 |
| Texas A&M |
37 |
7.40 |
1.03 |
| Arkansas |
36 |
7.20 |
0.87 |
| Ole Miss |
36 |
7.20 |
0.87 |
| Tennessee |
36 |
7.20 |
0.87 |
| Kentucky |
35 |
7.00 |
0.71 |
| Missouri |
34 |
6.80 |
0.55 |
| South Carolina |
34 |
6.80 |
0.55 |
| Florida |
33 |
6.60 |
0.39 |
| Alabama |
29 |
5.80 |
-0.25 |
| Auburn |
27 |
5.40 |
-0.57 |
| Vanderbilt |
26 |
5.20 |
-0.73 |
| Georgia |
22 |
4.40 |
-1.38 |
| Mississippi State |
22 |
4.40 |
-1.38 |
| LSU |
21 |
4.20 |
-1.54 |
Sun Belt
| 0 |
missing |
missing |
missing |
missing |
missing |
missing |
missing |
missing |
missing |
missing |
missing |
missing |
missing |
missing |
| 1 |
2 |
14 |
3 |
9 |
5 |
4 |
2 |
5 |
5 |
4 |
7 |
5 |
4 |
5 |
| 2 |
7 |
3 |
4 |
6 |
2 |
7 |
10 |
3 |
4 |
3 |
6 |
13 |
6 |
3 |
| 3 |
3 |
4 |
3 |
5 |
11 |
6 |
8 |
6 |
missing |
5 |
8 |
6 |
10 |
6 |
| 4 |
2 |
3 |
10 |
5 |
9 |
6 |
5 |
missing |
3 |
7 |
5 |
5 |
9 |
7 |
| 5 |
5 |
7 |
9 |
10 |
5 |
8 |
7 |
5 |
10 |
9 |
5 |
7 |
8 |
4 |
| Texas State |
37 |
7.40 |
1.20 |
| Southern Mississippi |
36 |
7.20 |
1.03 |
| Georgia Southern |
35 |
7.00 |
0.86 |
| Georgia State |
32 |
6.40 |
0.35 |
| Louisiana |
32 |
6.40 |
0.35 |
| Arkansas State |
31 |
6.20 |
0.18 |
| James Madison |
31 |
6.20 |
0.18 |
| South Alabama |
31 |
6.20 |
0.18 |
| Coastal Carolina |
29 |
5.80 |
-0.16 |
| Old Dominion |
28 |
5.60 |
-0.33 |
| Marshall |
22 |
5.50 |
-0.37 |
| Troy |
25 |
5.00 |
-0.83 |
| Louisiana Monroe |
19 |
4.75 |
-0.93 |
| Appalachian State |
19 |
3.80 |
-1.85 |
All FBS sorted by z-scores
| Colorado State |
39 |
9.75 |
2.67 |
| Colorado |
44 |
8.80 |
2.23 |
| Washington |
44 |
8.80 |
2.23 |
| East Carolina |
43 |
8.60 |
2.07 |
| New Mexico |
43 |
8.60 |
2.07 |
| UMass |
51 |
8.50 |
2.18 |
| Louisiana Tech |
42 |
8.40 |
1.91 |
| Michigan State |
40 |
8.00 |
1.59 |
| Middle Tennessee |
40 |
8.00 |
1.59 |
| Pittsburgh |
40 |
8.00 |
1.59 |
| South Florida |
40 |
8.00 |
1.59 |
| Syracuse |
40 |
8.00 |
1.59 |
| Bowling Green |
39 |
7.80 |
1.43 |
| USC |
39 |
7.80 |
1.43 |
| UTEP |
39 |
7.80 |
1.43 |
| Miami |
30 |
7.50 |
1.07 |
| Illinois |
37 |
7.40 |
1.11 |
| Texas A&M |
37 |
7.40 |
1.11 |
| Texas State |
37 |
7.40 |
1.11 |
| Toledo |
37 |
7.40 |
1.11 |
| UNLV |
37 |
7.40 |
1.11 |
| Akron |
36 |
7.20 |
0.96 |
| Arkansas |
36 |
7.20 |
0.96 |
| Ole Miss |
36 |
7.20 |
0.96 |
| Oregon |
36 |
7.20 |
0.96 |
| Southern Mississippi |
36 |
7.20 |
0.96 |
| Tennessee |
36 |
7.20 |
0.96 |
| Arizona |
35 |
7.00 |
0.80 |
| Georgia Southern |
35 |
7.00 |
0.80 |
| Kentucky |
35 |
7.00 |
0.80 |
| Oklahoma |
35 |
7.00 |
0.80 |
| TCU |
35 |
7.00 |
0.80 |
| UCF |
35 |
7.00 |
0.80 |
| Virginia |
35 |
7.00 |
0.80 |
| Louisville |
34 |
6.80 |
0.64 |
| Missouri |
34 |
6.80 |
0.64 |
| South Carolina |
34 |
6.80 |
0.64 |
| Utah State |
34 |
6.80 |
0.64 |
| Sam Houston State |
27 |
6.75 |
0.53 |
| Charlotte |
33 |
6.60 |
0.48 |
| Cincinnati |
33 |
6.60 |
0.48 |
| Connecticut |
33 |
6.60 |
0.48 |
| Florida |
33 |
6.60 |
0.48 |
| Hawai'i |
33 |
6.60 |
0.48 |
| Virginia Tech |
33 |
6.60 |
0.48 |
| Western Michigan |
33 |
6.60 |
0.48 |
| Notre Dame |
39 |
6.50 |
0.44 |
| Wisconsin |
26 |
6.50 |
0.36 |
| Georgia State |
32 |
6.40 |
0.32 |
| Kent State |
32 |
6.40 |
0.32 |
| Louisiana |
32 |
6.40 |
0.32 |
| NC State |
32 |
6.40 |
0.32 |
| Purdue |
32 |
6.40 |
0.32 |
| Liberty |
25 |
6.25 |
0.18 |
| Arkansas State |
31 |
6.20 |
0.16 |
| Buffalo |
31 |
6.20 |
0.16 |
| Eastern Michigan |
31 |
6.20 |
0.16 |
| Houston |
31 |
6.20 |
0.16 |
| James Madison |
31 |
6.20 |
0.16 |
| Oregon State |
31 |
6.20 |
0.16 |
| Rice |
31 |
6.20 |
0.16 |
| South Alabama |
31 |
6.20 |
0.16 |
| Florida International |
24 |
6.00 |
0.00 |
| Jacksonville State |
24 |
6.00 |
0.00 |
| Oklahoma State |
24 |
6.00 |
0.00 |
| Stanford |
30 |
6.00 |
0.00 |
| UCLA |
24 |
6.00 |
0.00 |
| Alabama |
29 |
5.80 |
-0.16 |
| Central Michigan |
29 |
5.80 |
-0.16 |
| Coastal Carolina |
29 |
5.80 |
-0.16 |
| San Diego State |
29 |
5.80 |
-0.16 |
| Washington State |
23 |
5.75 |
-0.18 |
| Fresno State |
28 |
5.60 |
-0.32 |
| Indiana |
28 |
5.60 |
-0.32 |
| Nebraska |
28 |
5.60 |
-0.32 |
| Old Dominion |
28 |
5.60 |
-0.32 |
| Florida State |
22 |
5.50 |
-0.35 |
| Marshall |
22 |
5.50 |
-0.35 |
| New Mexico State |
22 |
5.50 |
-0.35 |
| Auburn |
27 |
5.40 |
-0.48 |
| California |
27 |
5.40 |
-0.48 |
| Iowa State |
27 |
5.40 |
-0.48 |
| Miami (OH) |
27 |
5.40 |
-0.48 |
| SMU |
27 |
5.40 |
-0.48 |
| Temple |
27 |
5.40 |
-0.48 |
| Tulane |
27 |
5.40 |
-0.48 |
| Western Kentucky |
27 |
5.40 |
-0.48 |
| Kansas State |
21 |
5.25 |
-0.53 |
| Ohio State |
21 |
5.25 |
-0.53 |
| Vanderbilt |
26 |
5.20 |
-0.64 |
| BYU |
25 |
5.00 |
-0.79 |
| Florida Atlantic |
20 |
5.00 |
-0.71 |
| Georgia Tech |
25 |
5.00 |
-0.79 |
| Maryland |
25 |
5.00 |
-0.79 |
| North Carolina |
20 |
5.00 |
-0.71 |
| North Texas |
20 |
5.00 |
-0.71 |
| Penn State |
25 |
5.00 |
-0.79 |
| Texas Tech |
25 |
5.00 |
-0.79 |
| Troy |
25 |
5.00 |
-0.79 |
| UAB |
25 |
5.00 |
-0.79 |
| Arizona State |
24 |
4.80 |
-0.95 |
| Ball State |
24 |
4.80 |
-0.95 |
| Baylor |
24 |
4.80 |
-0.95 |
| Kansas |
24 |
4.80 |
-0.95 |
| Utah |
24 |
4.80 |
-0.95 |
| Louisiana Monroe |
19 |
4.75 |
-0.89 |
| UT San Antonio |
19 |
4.75 |
-0.89 |
| Nevada |
23 |
4.60 |
-1.11 |
| Northern Illinois |
23 |
4.60 |
-1.11 |
| Tulsa |
23 |
4.60 |
-1.11 |
| Wyoming |
23 |
4.60 |
-1.11 |
| Clemson |
22 |
4.40 |
-1.27 |
| Duke |
22 |
4.40 |
-1.27 |
| Georgia |
22 |
4.40 |
-1.27 |
| Mississippi State |
22 |
4.40 |
-1.27 |
| Navy |
17 |
4.25 |
-1.24 |
| LSU |
21 |
4.20 |
-1.43 |
| Memphis |
21 |
4.20 |
-1.43 |
| Texas |
21 |
4.20 |
-1.43 |
| Northwestern |
20 |
4.00 |
-1.59 |
| Rutgers |
20 |
4.00 |
-1.59 |
| Appalachian State |
19 |
3.80 |
-1.75 |
| Wake Forest |
15 |
3.75 |
-1.60 |
| Boise State |
18 |
3.60 |
-1.91 |
| West Virginia |
18 |
3.60 |
-1.91 |
| Ohio |
13 |
3.25 |
-1.96 |
| Air Force |
15 |
3.00 |
-2.39 |
| Iowa |
15 |
3.00 |
-2.39 |
| Minnesota |
14 |
2.80 |
-2.54 |
| Michigan |
13 |
2.60 |
-2.70 |
| Army |
8 |
2.00 |
-2.85 |
| Boston College |
50 |
10.00 |
3.18 |
Data: @CFB_Data or collegefootballdata.com
FanPosts are just that; posts created by the fans. They are in no way indicative of the opinions of SBN and the authors of Roll Bama Roll.
Loading comments...